تم الحل ✓
categoryإحصاء
schoolبكالوريوس
event_available2026-07-14
السؤال
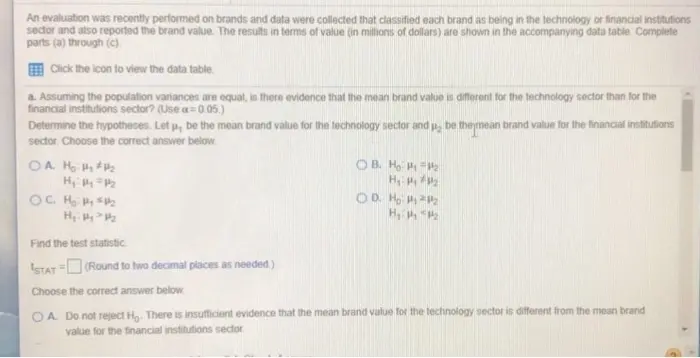
Transcribed Image Text:
An evaluation was recently performed on brands and data were collected that classified each brand as being in the technology or financial institutions
sector and also reported the brand value. The results in terms of value (in millions of dollars) are shown in the accompanying data table. Complete
parts (a) through (c)
Click the icon to view the data table.
a. Assuming the population variances are equal, is there evidence that the mean brand value is different for the technology sector than for the
financial institutions sector? (Use a=0.05.)
Determine the hypotheses. Let μ, be the mean brand value for the technology sector and p₂ be the mean brand value for the financial institutions
sector. Choose the correct answer below.
OA. Ho₂
H₁₁₂
OC. H₂ P₁₂
Find the test statistic
STAT (Round to two decimal places as needed.)
Choose the correct answer below
OB. Ho HP2
H₁₁₂
OD. Ho
H₁: "#2
OA. Do not reject Ho. There is insufficient evidence that the mean brand value for the technology sector is different from the mean brand
value for the financial institutions sector.
An evaluation was recently performed on brands and data were collected that classified each brand as being in the technology or financial institutions
sector and also reported the brand value. The results in terms of value (in millions of dollars) are shown in the accompanying data table. Complete
parts (a) through (c).
Click the icon to view the data table.
OA. Do not reject Ho. There is insufficient evidence that the mean brand value for the technology sector is different from the mean brand
value for the financial institutions sector.
B. Reject Ho. There is sufficient evidence that the mean brand value for the technology sector is different from the mean brand value for the
financial institutions sector.
OC. Reject Ho. There is insufficient evidence that the mean brand value for the technology sector is different from the mean brand value for
the financial institutions sector.
OD. Do not reject H₂. There is sufficient evidence that the mean brand value for the technology sector is different from the mean brand value
for the financial institutions sector
b. Repeat (a), assuming that the population variances are not equal
Determine the hypotheses. Choose the correct answer below.
OA Ho₁₂
H₁₁₂
OC. Ho₁₂
OB. Ho
H₁₁₂
OD. Ho PP₂
H₁ PP2
Click to select your answer(s) and then click Check Answer
An evaluation was recently performed on brands and data were collected that classified each brand as being in the technology or financial institutions
sector and also reported the brand value. The results in terms of value (in millions of dollars) are shown in the accompanying data table. Complete
parts (a) through (c).
Click the icon to view the data table.
Find the test statistic
STAT
(Round to two decimal places as needed.)
Choose the correct answer below.
OA. Reject Ho. There is insufficient evidence that the mean brand value for the technology sector is less than the mean brand value for the
financial institutions sector
OB. Do not reject Ho. There is sufficient evidence that the mean brand value for the technology sector is less than the mean brand value for
the financial institutions sector.
OC. Do not reject Ho There is insufficient evidence that the mean brand value for the technology sector is less than the mean brand value for
the financial institutions sector.
OD. Reject Ho There is sufficient evidence that the mean brand value for the technology sector is less than the mean brand value for the
financial institutions sector.
c. Compare the results of (a) and (b)
A The mnclneinne for norte fal and hi hath roiart the mid himathacie
Click to select your answer(s) and then click Check Answer
An evaluation was recently performed on brands and data were collected that classified each brand as being in the technology or financial institutions
sector and also reported the brand value. The results in terms of value (in millions of dollars) are shown in the accompanying data table. Complete
parts (a) through (c).
Click the icon to view the data table.
Choose the correct answer Deflow.
OA. Reject Ho. There is insufficient evidence that the mean brand value for the technology sector is less than the mean brand value for the
financial institutions sector
OB. Do not reject Ho. There is sufficient evidence that the mean brand value for the technology sector is less than the mean brand value for
the financial institutions sector.
OC. Do not reject Ho. There is insufficient evidence that the mean brand value for the technology sector is less than the mean brand value for
the financial institutions sector
OD. Reject Ho There is sufficient evidence that the mean brand value for the technology sector is less than the mean brand value for the
financial institutions sector
c. Compare the results of (a) and (b)
A. The conclusions for parts (a) and (b) both reject the null hypothesis
B. The conclusions for parts (a) and (b) both do not reject the null hypothesis
C. The conclusions for parts (a) and (b) are different. Reject the null hypothesis in (a) and do not reject it in (b)
OD. The conclusions for parts (a) and (b) are different. Reject the null hypothesis in (b) and do not reject it in (a).
Brand Values
Technology
Financial Institutions
269
525
354
824
406
812
446
898
416
988
511
965
613
1096
614
1067
or
por
Print
Done
- X
check_circle الجواب — حل مفصل خطوة بخطوة
hourglass_top
🔒
الحل الكامل متاح للمشتركين
اشترك في أرشيف الأسئلة لعرض هذا الحل وآلاف الحلول المفصلة خطوة بخطوة من معلمين معتمدين.