تم الحل ✓
categoryالكيمياء
schoolبكالوريوس
event_available2026-07-14
السؤال
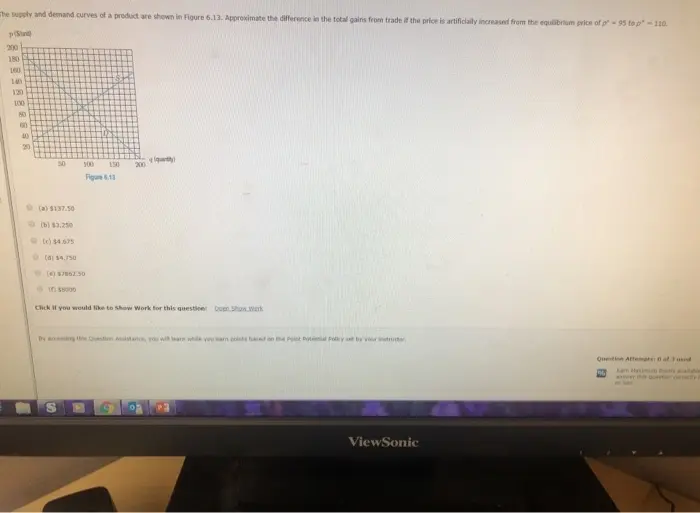
Transcribed Image Text:
The supply and demand curves of a product are shown in Figure 6.13. Approximate the difference in the total gains from trade if the price is artificially increased from the equilibrium price of p-95 top-110.
piS
200
180
160
140
120
100
80
60
40
20
50
100 150
Figure 4.13
200
(a) $137.50
(b) $3,250
(c) $4,675
(d) $4,750
(4)7962.50
() $8000
Click if you would like to Show Work for this question: Doen Show.Wark
By accessing this Question Assistance, you will learn whe
warn points based on the Point Potential Policy
your trudar
Question Attempts: 0 of 3 used
ViewSonic
check_circle الجواب — حل مفصل خطوة بخطوة
hourglass_top
🔒
الحل الكامل متاح للمشتركين
اشترك في أرشيف الأسئلة لعرض هذا الحل وآلاف الحلول المفصلة خطوة بخطوة من معلمين معتمدين.