تم الحل ✓
categoryإحصاء
schoolبكالوريوس
event_available2026-07-14
السؤال
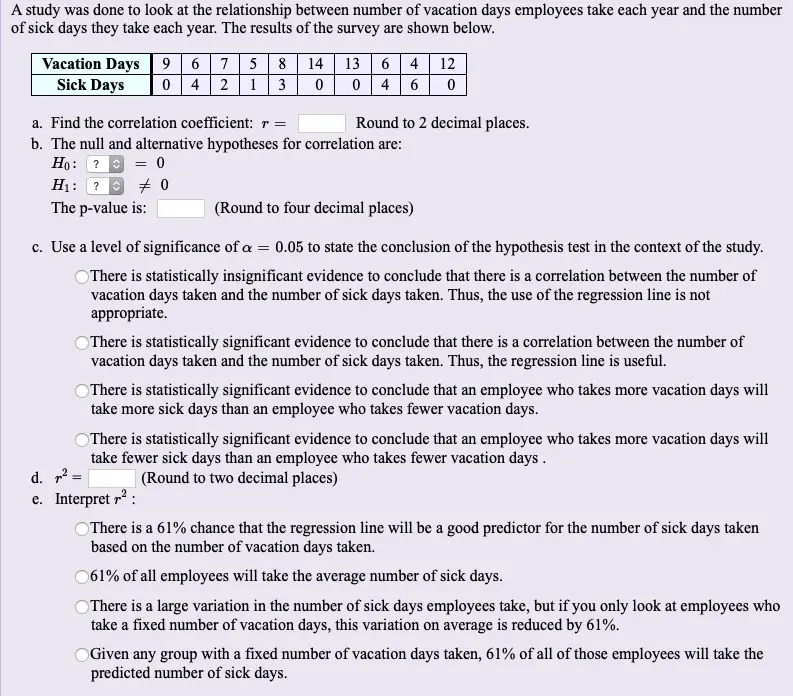
Transcribed Image Text:
A study was done to look at the relationship between number of vacation days employees take each year and the number
of sick days they take each year. The results of the survey are shown below.
Vacation Days 9 675814 13 6 4 12
Sick Days
0421 30
0 4 6 0
Round to 2 decimal places.
a. Find the correlation coefficient: r =
b. The null and alternative hypotheses for correlation are:
Ho:
0
H₁:
0
The p-value is:
(Round to four decimal places)
c. Use a level of significance of α = 0.05 to state the conclusion of the hypothesis test in the context of the study.
There is statistically insignificant evidence to conclude that there is a correlation between the number of
vacation days taken and the number of sick days taken. Thus, the use of the regression line is not
appropriate.
d. m²
There is statistically significant evidence to conclude that there is a correlation between the number of
vacation days taken and the number of sick days taken. Thus, the regression line is useful.
There is statistically significant evidence to conclude that an employee who takes more vacation days will
take more sick days than an employee who takes fewer vacation days.
There is statistically significant evidence to conclude that an employee who takes more vacation days will
take fewer sick days than an employee who takes fewer vacation days.
e. Interpret ²:
(Round to two decimal places)
There is a 61% chance that the regression line will be a good predictor for the number of sick days taken
based on the number of vacation days taken.
061% of all employees will take the average number of sick days.
There is a large variation in the number of sick days employees take, but if you only look at employees who
take a fixed number of vacation days, this variation on average is reduced by 61%.
Given any group with a fixed number of vacation days taken, 61% of all of those employees will take the
predicted number of sick days.
f. The equation of the linear regression line is:
ŷ =
(Please show your answers to two decimal places)
g. Use the model to predict the number of sick days taken for an employee who took 3 vacation days this year.
Sick Days =
(Please round your answer to the nearest whole number.)
h. Interpret the slope of the regression line in the context of the question:
For every additional vacation day taken, employees tend to take on average 0.48 fewer sick days.
The slope has no practical meaning since a negative number cannot occur with vacation days and sick days.
As x goes up, y goes down.
i. Interpret the y-intercept in the context of the question:
The y-intercept has no practical meaning for this study.
If an employee takes no vacation days, then that employee will take 6 sick days.
The best prediction for an employee who doesn't take any vacation days is that the employee will take 6
sick days.
The average number of sick days is predicted to be 6.
check_circle الجواب — حل مفصل خطوة بخطوة
hourglass_top
🔒
الحل الكامل متاح للمشتركين
اشترك في أرشيف الأسئلة لعرض هذا الحل وآلاف الحلول المفصلة خطوة بخطوة من معلمين معتمدين.