تم الحل ✓
categoryإدارة أعمال
schoolبكالوريوس
event_available2026-07-14
السؤال
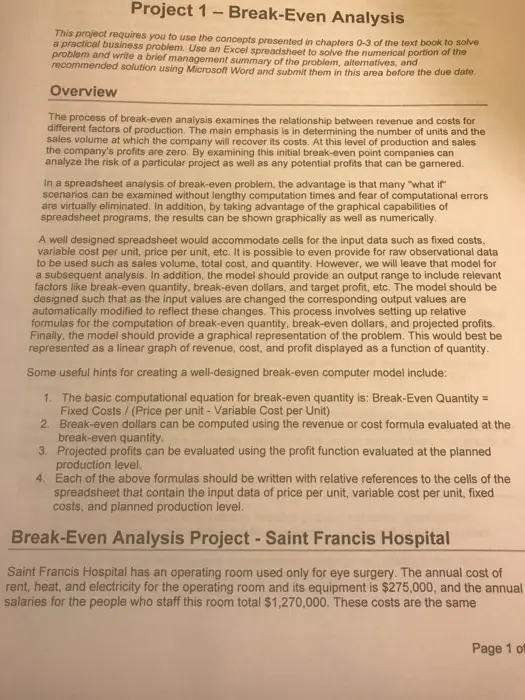
Transcribed Image Text:
Project 1 - Break-Even Analysis
This project requires you to use the concepts presented in chapters 0-3 of the text book to solve
a practical business problem. Use an Excel spreadsheet to solve the numerical portion of the
problem and write a brief management summary of the problem, alternatives, and
recommended solution using Microsoft Word and submit them in this area before the due date.
Overview
The process of break-even analysis examines the relationship between revenue and costs for
different factors of production. The main emphasis is in determining the number of units and the
sales volume at which the company will recover its costs. At this level of production and sales
the company's profits are zero. By examining this initial break-even point companies can
analyze the risk of a particular project as well as any potential profits that can be garnered.
In a spreadsheet analysis of break-even problem, the advantage is that many "what if"
scenarios can be examined without lengthy computation times and fear of computational errors
are virtually eliminated. In addition, by taking advantage of the graphical capabilities of
spreadsheet programs, the results can be shown graphically as well as numerically.
A well designed spreadsheet would accommodate cells for the input data such as fixed costs,
variable cost per unit, price per unit, etc. It is possible to even provide for raw observational data
to be used such as sales volume, total cost, and quantity. However, we will leave that model for
a subsequent analysis. In addition, the model should provide an output range to include relevant
factors like break-even quantity, break-even dollars, and target profit, etc. The model should be
designed such that as the input values are changed the corresponding output values are
automatically modified to reflect these changes. This process involves setting up relative
formulas for the computation of break-even quantity, break-even dollars, and projected profits.
Finally, the model should provide a graphical representation of the problem. This would best be
represented as a linear graph of revenue, cost, and profit displayed as a function of quantity.
Some useful hints for creating a well-designed break-even computer model include:
1. The basic computational equation for break-even quantity is: Break-Even Quantity
Fixed Costs / (Price per unit - Variable Cost per Unit)
=
2. Break-even dollars can be computed using the revenue or cost formula evaluated at the
break-even quantity.
3. Projected profits can be evaluated using the profit function evaluated at the planned
production level.
4. Each of the above formulas should be written with relative references to the cells of the
spreadsheet that contain the input data of price per unit, variable cost per unit, fixed
costs, and planned production level.
Break-Even Analysis Project - Saint Francis Hospital
Saint Francis Hospital has an operating room used only for eye surgery. The annual cost of
rent, heat, and electricity for the operating room and its equipment is $275,000, and the annual
salaries for the people who staff this room total $1,270,000. These costs are the same
Page 1 of
regardless how many surgeries are performed. Each surgery performed requires the use of
$1,375 worth of medical supplies and drugs. To promote goodwill, every patient receives ch
bouquet of flowers the day after surgery. In addition, all patients require dark glasses, which the
hospital provides free-of-charge. It costs the hospital $55 for each bouquet of flowers and $25
for each pair of glasses. The hospital receives a payment of $3,500 for each eye operation
performed. Last year the hospital performed 950 operations and plans to continue at this level of
production.
Identify the revenue per case (price per unit) and the annual fixed and variable costs for running
the operating room. Set up your spreadsheet so that theses inputs can readily be changed. Set
up an output range to calculate the break-even quantity and dollar amount for total revenue and
costs. Also, set up an output range to display the projected profits resulting from different levels
of production. How many eye operations must the hospital perform each year in order to break
even? What would the annual profits be if they perform 950 operations each year?
One of the nurses has just learned about a machine that would reduce the cost of medical
supplies needed by $580 per patient. It can be leased for $475,000 annually. Keeping in mind
the financial costs and benefits, advise the hospital on whether or not they should lease this
machine. Use the spreadsheet to identify the break-even point and the level of profit associated
with 950 operations per year. Modify the fixed and variable costs as appropriate and examine
the break-even quantity and profits again.
An advertising agency has proposed to the hospital's president that she spend $10,000 per
month on television and radio advertising to persuade people that Saint Francis Hospital is the
best place to have any eye surgery performed. The advertising firm estimates that such publicity
would increase business by 30 operations per month. If they are correct, what impact would this
advertising have on hospital's profit? What would happen to the break-even point? In case the
advertising agency is being overly optimistic, what would the decision be if the advertising
campaign only increased the number of operation per month by 5? What is the maximum
amount the Hospital would be willing to pay for the advertising if the ads generated 30 additional
operations each month? Consider this option independent of the machine purchase described
above.
Assuming the hospital decided to use the advertising program, should the hospital then also
purchase the machine? What impact do these decisions have on profits and risk for the
hospital?
Prepare a written report summarizing your results and recommendations. Include an
explanation of the effects of changing the price, variable cost, and fixed costs on the break-even
point and profits. The report should include printouts of the various spreadsheets and graphs to
support your conclusions.
Deliverables
1. Executive summary report to address relevant problem definition, assumptions,
alternative solutions, and optimal solutions selection. A Microsoft Word file entitled,
Project1.docx
2. Detailed numerical analysis with appropriate calculations and charts for the various
scenarios. A Microsoft Excel file entitled, Project1.xlsx
Roge 2
check_circle الجواب — حل مفصل خطوة بخطوة
hourglass_top
🔒
الحل الكامل متاح للمشتركين
اشترك في أرشيف الأسئلة لعرض هذا الحل وآلاف الحلول المفصلة خطوة بخطوة من معلمين معتمدين.