تم الحل ✓
categoryرياضيات
schoolبكالوريوس
event_available2026-07-14
السؤال
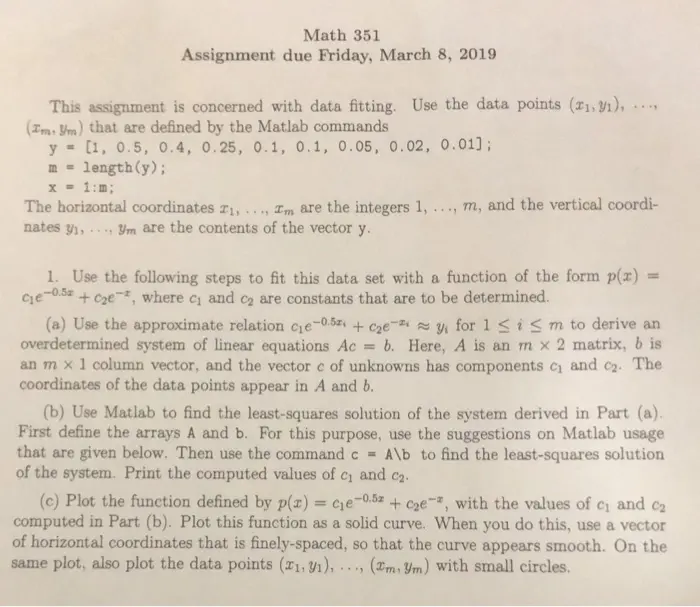
Transcribed Image Text:
Math 351
Assignment due Friday, March 8, 2019
This assignment is concerned with data fitting. Use the data points (1, 1),
(Im. m) that are defined by the Matlab commands
y = [1, 0.5, 0.4, 0.25, 0.1, 0.1, 0.05, 0.02, 0.01];
m = length(y);
x = 1:m;
The horizontal coordinates 21,..., Im are the integers 1, ..., m, and the vertical coordi-
Um are the contents of the vector y.
nates y1,-
1. Use the following steps to fit this data set with a function of the form p(x)
C₁e-0.5*+ C₂e, where c₁ and c₂ are constants that are to be determined.
(a) Use the approximate relation c₁e-0.5, +C₂ey for 1≤i≤m to derive an
overdetermined system of linear equations Ac b. Here, A is an m x 2 matrix, b is
an m x 1 column vector, and the vector c of unknowns has components c₁ and c2. The
coordinates of the data points appear in A and b.
(b) Use Matlab to find the least-squares solution of the system derived in Part (a).
First define the arrays A and b. For this purpose, use the suggestions on Matlab usage
that are given below. Then use the command c = A\b to find the least-squares solution
of the system. Print the computed values of c₁ and c₂.
(c) Plot the function defined by p(x) = c₁e-0.52 + C₂e, with the values of c₁ and c₂
computed in Part (b). Plot this function as a solid curve. When you do this, use a vector
of horizontal coordinates that is finely-spaced, so that the curve appears smooth. On the
same plot, also plot the data points (1, 1), (m, 3m) with small circles.
check_circle الجواب — حل مفصل خطوة بخطوة
hourglass_top
🔒
الحل الكامل متاح للمشتركين
اشترك في أرشيف الأسئلة لعرض هذا الحل وآلاف الحلول المفصلة خطوة بخطوة من معلمين معتمدين.