تم الحل ✓
categoryعلم الاجتماع
schoolبكالوريوس
event_available2026-07-14
السؤال
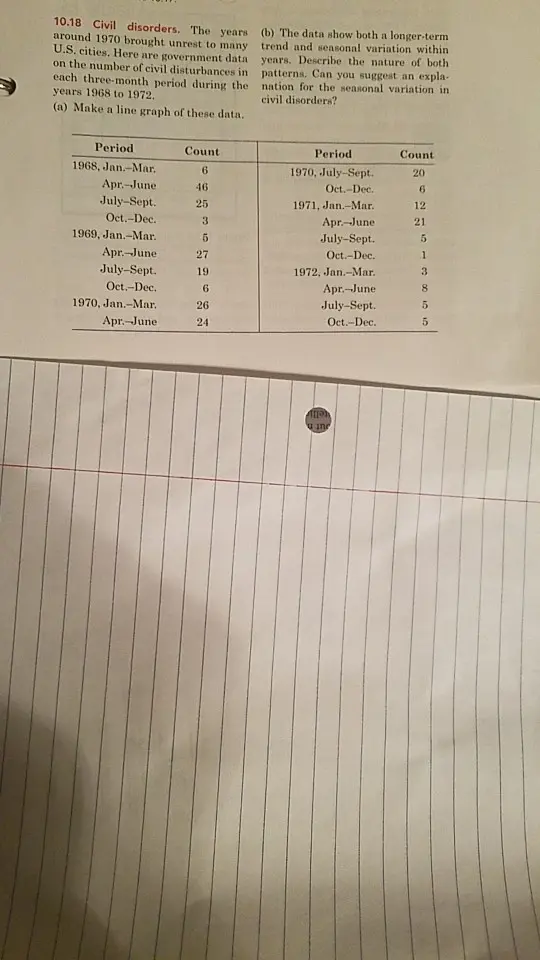
Transcribed Image Text:
10.18 Civil disorders. The years
around 1970 brought unrest to many
U.S. cities. Here are government data
on the number of civil disturbances in
each three-month period during the
years 1968 to 1972.
(a) Make a line graph of these data.
(b) The data show both a longer-term
years. Describe the nature of both
trend and seasonal variation within
patterns. Can you suggest an expla-
nation for the seasonal variation in
civil disorders?
Period
1968, Jan.-Mar.
Count
6
Apr.-June
46
Period
1970, July-Sept.
Oct.-Dec.
Count
20
6.
July-Sept.
25
1971, Jan.-Mar.
12
Oct.-Dec.
3
Apr.-June
21
1969, Jan.-Mar.
5
July-Sept.
5
Apr-June
27
Oct.-Dec.
1
July-Sept.
19
1972, Jan.-Mar.
3
Oct.-Dec.
6
1970, Jan.-Mar.
26
Apr.-June
July-Sept.
8
5
Apr-June
24
Oct.-Dec.
5
u in
check_circle الجواب — حل مفصل خطوة بخطوة
hourglass_top
🔒
الحل الكامل متاح للمشتركين
اشترك في أرشيف الأسئلة لعرض هذا الحل وآلاف الحلول المفصلة خطوة بخطوة من معلمين معتمدين.