تم الحل ✓
categoryفيزياء
schoolبكالوريوس
event_available2026-07-14
السؤال
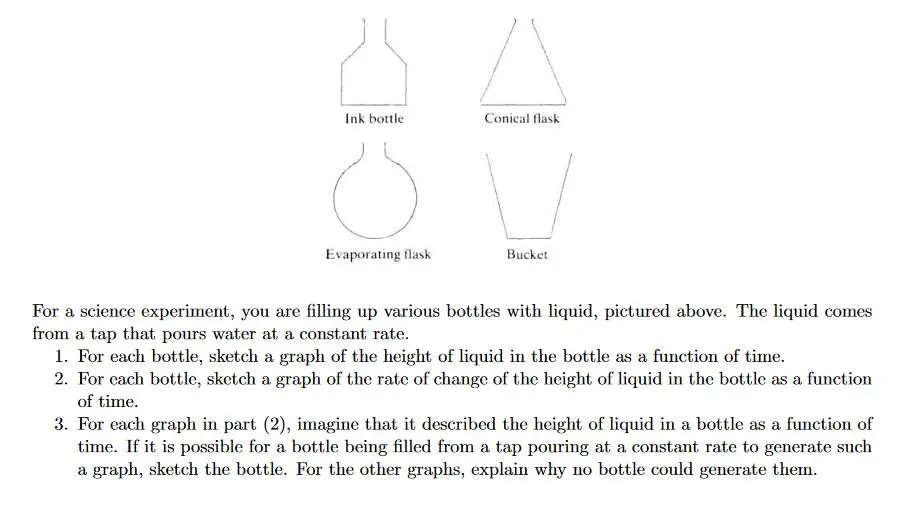
Transcribed Image Text:
Ink bottle
Conical flask
Evaporating flask
Bucket
For a science experiment, you are filling up various bottles with liquid, pictured above. The liquid comes
from a tap that pours water at a constant rate.
1. For each bottle, sketch a graph of the height of liquid in the bottle as a function of time.
2. For each bottle, sketch a graph of the rate of change of the height of liquid in the bottle as a function
of time.
3. For each graph in part (2), imagine that it described the height of liquid in a bottle as a function of
time. If it is possible for a bottle being filled from a tap pouring at a constant rate to generate such
a graph, sketch the bottle. For the other graphs, explain why no bottle could generate them.
check_circle الجواب — حل مفصل خطوة بخطوة
hourglass_top
🔒
الحل الكامل متاح للمشتركين
اشترك في أرشيف الأسئلة لعرض هذا الحل وآلاف الحلول المفصلة خطوة بخطوة من معلمين معتمدين.