تم الحل ✓
categoryرياضيات
schoolبكالوريوس
event_available2026-07-14
السؤال
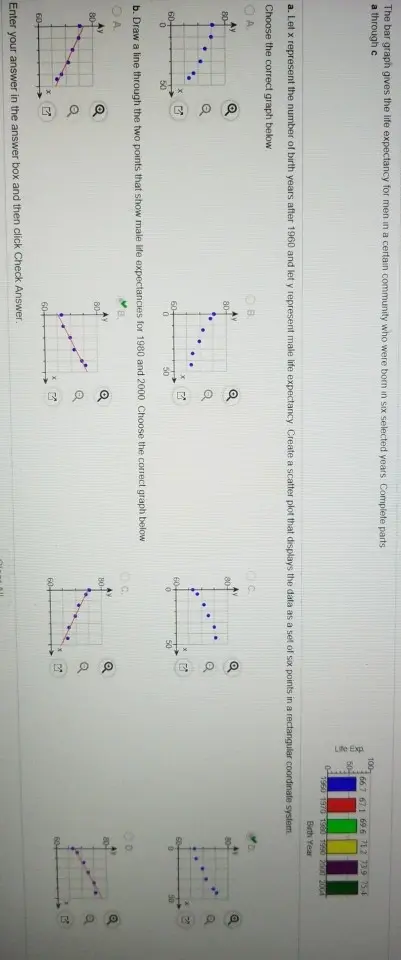
Transcribed Image Text:
The bar graph gives the life expectancy for men in a certain community who were born in six selected years. Complete parts
a through c
Life Exp.
100-
66.7 67.1 69.6 71.2 73.9 754
50
1950 1970 1980 1990 2000 2004
Birth Year
a. Let x represent the number of birth years after 1960 and let y represent male life expectancy Create a scatter plot that displays the data as a set of six points in a rectangular coordinate system
Choose the correct graph below.
OA.
Ay
80-
60-
0
50
Q
G
B
Q
80-
60+
0
50
b. Draw a line through the two points that show male life expectancies for 1980 and 2000. Choose the correct graph below.
OA.
Ay
80-
Q
B
80-
Q
ROO
60-
E
60-
Enter your answer in the answer box and then click Check Answer.
80-
60-
Ay
80-
BOO
Q
Use the coordinates of the two points that show male life expectancies for 1980 and 2000 to write a linear function that models life expectancy, E(x), for men born in this community x years after 1960
E(x) 0.215x+65.3
(Use integers or decimals for any numbers in the expression. Type your answer in slope-intercept form.)
c. Use the function from part (b) to project the life expectancy of men born in this community in 2020.
Their projected life expectancy is years
(Type an integer or a decimal)
Enter your answer in the answer box and then click Check Answer.
check_circle الجواب — حل مفصل خطوة بخطوة
hourglass_top
🔒
الحل الكامل متاح للمشتركين
اشترك في أرشيف الأسئلة لعرض هذا الحل وآلاف الحلول المفصلة خطوة بخطوة من معلمين معتمدين.