تم الحل ✓
categoryرياضيات
schoolبكالوريوس
event_available2026-07-14
السؤال
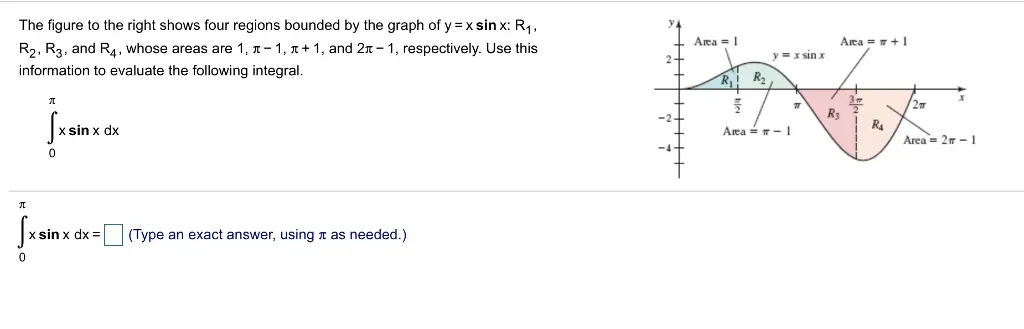
Transcribed Image Text:
The figure to the right shows four regions bounded by the graph of y=xsin x: R₁,
R2, R3, and R4, whose areas are 1, л-1, +1, and 2л-1, respectively. Use this
information to evaluate the following integral.
Π
S
0
x sin x dx
元
Sxsin x
x sin x dx =
0
(Type an exact answer, using as needed.)
2
Area = 1
y=xsin x
Area = +1
R₁
R₂
플
2
R3
-2
Area = -1
Area 2-1
The figure to the right shows the area of regions bounded by the
graph of f and the x-axis. Evaluate the following integral.
с
Sf(x)dx
a
C
froxjdx=(Type an integer or a simplified fraction.)
a
24
y = f(x)
5
13
The figure to the right shows the area of regions bounded by the
graph of f and the x-axis. Evaluate the following integral.
0
f(x)dx
So
0
f(x)dx = (Type an integer or a simplified fraction.)
14
y = f(x)
4
12
Use geometry (not Riemann sums) to evaluate the following definite integral.
5
So f
5
if x ≤4
0
f(x)dx where f(x)=2x-3 if x>4
The following function is positive and negative on the given interval.
π
f(x) = sin 3x;
a. Sketch the function on the given interval.
b. Approximate the net area bounded by the graph of f and the x-axis on the interval using a left, right, and midpoint Riemann sum with n = 4.
Π
c. Use the sketch in part (a) to show which intervals of
л make positive and negative contributions to the net area.
2
check_circle الجواب — حل مفصل خطوة بخطوة
hourglass_top
🔒
الحل الكامل متاح للمشتركين
اشترك في أرشيف الأسئلة لعرض هذا الحل وآلاف الحلول المفصلة خطوة بخطوة من معلمين معتمدين.