تم الحل ✓
categoryهندسة كهربائية
schoolبكالوريوس
event_available2026-07-14
السؤال
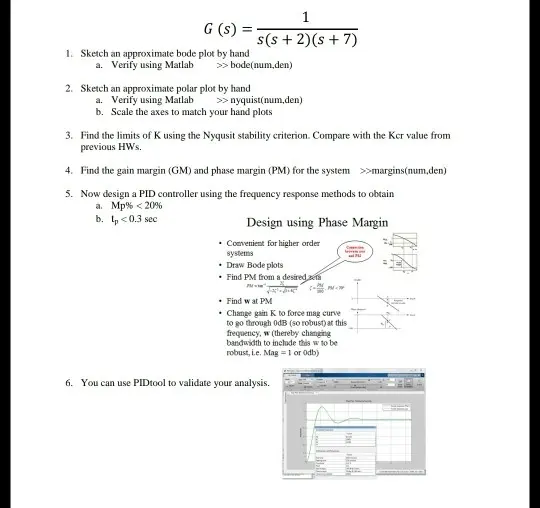
Transcribed Image Text:
1
G (s):
s(s + 2)(s+7)
1. Sketch an approximate bode plot by hand
a. Verify using Matlab
>> bode(num,den)
2. Sketch an approximate polar plot by hand
a. Verify using Matlab
>>nyquist(num,den)
b. Scale the axes to match your hand plots
3. Find the limits of K using the Nyqusit stability criterion. Compare with the Ker value from
previous HWs.
4. Find the gain margin (GM) and phase margin (PM) for the system >>margins(num,den)
5. Now design a PID controller using the frequency response methods to obtain
a. Mp% <20%
b. tp <0.3 sec
Design using Phase Margin
⚫Convenient for higher order
systems
C
Draw Bode plots
⚫Find PM from a desired ea
⚫ Find w at PM
⚫ Change gain K to force mag curve
to go through 0dB (so robust) at this
frequency, w (thereby changing
bandwidth to include this w to be
robust, i.e. Mag=1 or 0db)
6. You can use PIDtool to validate your analysis.
check_circle الجواب — حل مفصل خطوة بخطوة
hourglass_top
🔒
الحل الكامل متاح للمشتركين
اشترك في أرشيف الأسئلة لعرض هذا الحل وآلاف الحلول المفصلة خطوة بخطوة من معلمين معتمدين.