تم الحل ✓
categoryالاقتصاد والأعمال
schoolبكالوريوس
event_available2026-07-14
السؤال
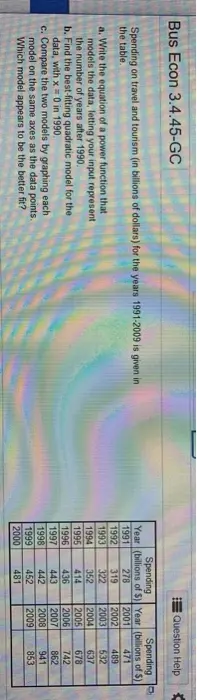
Transcribed Image Text:
Bus Econ 3.4.45-GC
Spending on travel and tourism (in billions of dollars) for the years 1991-2009 is given in
the table.
a. Write the equation of a power function that
models the data, letting your input represent
the number of years after 1990.
b. Find the best-fitting quadratic model for the
data, with x 0 in 1990.
c. Compare the two models by graphing each
model on the same axes as the data points.
Which model appears to be the better fit?
Question Help
Spending
Spending
Year (billions of $) Year
(billions of $)
1991
278
2001
471
1992
319
2002
489
1993
322
2003
532
1994
352
2004
637
1995
414
2005
678
1996
436
2006
742
1997
443
2007
862
1998
442
2008
941
1999
452
2009
853
2000
481
Homework: Section 4.1 Homework
Score: 0 of 1 pt
4.1.3
Consider the functions y√x and y√x+6.
Sav
1 of 21 (0 complete)
HW Score: 0%, 0 of 21
Question Help
(a) Sketch the graph of the pair of functions using a standard window.
(b) Describe the transformation used to obtain the graph of the second function from the first function.
(a) Which of the following is the correct graph of the functions y=√√x (indicated in blue) and y = √x+6 (indicated in red)?
OA.
O B.
Ay
Q
O C.
OD.
4.1.5
Consider the functions y=√x and y=√x-6+4.
(a) Sketch the graph of the pair of functions using a standard window
(b) Describe the transformation used to obtain the graph of the second function from the first function.
(a) Which of the following is the correct graph of the functions y=√x (indicated in blue) and y√x-6+4 (indicated in red)?
OA.
OB.
Q
OC.
O D.
12
12
12
a
ROO
Question He
check_circle الجواب — حل مفصل خطوة بخطوة
hourglass_top
🔒
الحل الكامل متاح للمشتركين
اشترك في أرشيف الأسئلة لعرض هذا الحل وآلاف الحلول المفصلة خطوة بخطوة من معلمين معتمدين.