تم الحل ✓
categoryإدارة أعمال
schoolبكالوريوس
event_available2026-07-14
السؤال
Transcribed Image Text:
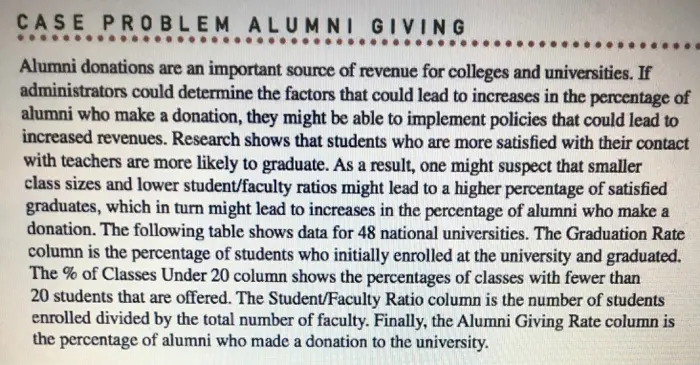
CASE PROBLEM ALUMNI GIVING
Alumni donations are an important source of revenue for colleges and universities. If
administrators could determine the factors that could lead to increases in the percentage of
alumni who make a donation, they might be able to implement policies that could lead to
increased revenues. Research shows that students who are more satisfied with their contact
with teachers are more likely to graduate. As a result, one might suspect that smaller
class sizes and lower student/faculty ratios might lead to a higher percentage of satisfied
graduates, which in turn might lead to increases in the percentage of alumni who make a
donation. The following table shows data for 48 national universities. The Graduation Rate
column is the percentage of students who initially enrolled at the university and graduated.
The % of Classes Under 20 column shows the percentages of classes with fewer than
20 students that are offered. The Student/Faculty Ratio column is the number of students
enrolled divided by the total number of faculty. Finally, the Alumni Giving Rate column is
the percentage of alumni who made a donation to the university.
Graduation
State
Rate
% of
Classes
Under 20
Student/ Alumni
Faculty
Ratio
Giving
Rate
Boston College
MA
Brandeis University
MA
Brown University
RI
California Institute of
CA
5225
85
39
13
79
68
93
60
85
65
Technology
Carnegie Mellon University
PA
75
Case Western Reserve Univ.
OH
72
College of William and Mary
89
Columbia University
NY
90
Comell University
NY
91
Dartmouth College
NH
94
Duke University
NC
92
Emory University
GA
84
1246265
67
69
72
68
234
3883
08273018T
25
33
40
46
28
31
27
31
35
53
45
37
(Continued)
% of
Graduation
Student/ Alumni
Classes Faculty Giving
State
Rate
Under 20
Ratio
Rate
Georgetown University
DC
91
Harvard University
MA
97
Johns Hopkins University
MD
89
Lehigh University
PA
81
Massachusetts Institute
MA
92
13155
54
73
64
11
65
08816
B
9
24444
29
46
27
40
of Technology
New York University
NY
72
Northwestern University
IL
Pennsylvania State Univ.
PA
Princeton University
NJ
Rice University
TX
Stanford University
CA
Tufts University
MA
Tulane University
LA
University of
CA
2282228
63
90
66
80
32
95
68
92
62
92
69
87
67
72
56
83
58
17
38658927
13
13
30
19
21
67
40
34
29
12
17
18
California-Berkeley
University of California-Davis
University of California-Irvine
CA
University of California-
CA
333
CA
778
74
74
274
32
19
42
41
1280
13
763
9
Los Angeles
University of California-
San Diego
Unimity of California
CA
80
80
48
19
8
CA
70
ΛΕ
20
12
San Diego
University of California-
Santa Barbara
CA
70
70
55
45
20
20
12
12
University of Chicago
IL
University of Florida
FL
45
84
67
University of Illinois-
IL
77
Urbana Champaign
University of Michigan-
MI
Ann Arbor
University of North
NC
Carolina-Chapel Hill
University of Notre Dame
IN
University of Pennsylvania
PA
University of Rochester
NY
University of Southern
Califomia
CA
University of Texas-Austin
TX
University of Virginia
VA
University of Washington
University of
WI
Wisconsin-Madison
Vanderbilt University
Wake Forest University
Washington University-
St. Louis
Yale University
토일 김삼중 스승들도 주문을 하
83
33
51
425
65
36
31
23
19
29
15
23
15
13
32
82
40
40
16
16
26
26
94
2200
53
90
65
76
63
70
53
3703
13
49
10
13
WA
1203
66
92
70
73
3433
39
21
44
13
37
12
37
13
2323
13
TN
NC
MO
8888
82
68
82
86
883
59
11
73
916
31
38
33
EN 222 223
41
23
22
13
28
12
CT
14
94
77
7
50
Managerial Report
1. Use methods of descriptive statistics to summarize the data.
2. Develop an estimated simple linear regression model that can be used to predict the
alumni giving rate, given the graduation rate. Discuss your findings.
3. Develop an estimated multiple linear regression model that could be used to predict
the alumni giving rate using the Graduation Rate, % of Classes Under 20, and Student/
Faculty Ratio as independent variables. Discuss your findings.
4. Based on the results in parts (2) and (3), do you believe another regression model may
be more appropriate? Estimate this model, and discuss your results.
5. What conclusions and recommendations can you derive from your analysis? What
universities are achieving a substantially higher alumni giving rate than would be
expected, given their Graduation Rate, % of Classes Under 20, and Student/Faculty
Ratio? What universities are achieving a substantially lower alumni giving rate than
would be expected, given their Graduation Rate, % of Classes Under 20, and Student/
Faculty Ratio? What other independent variables could be included in
the model?
check_circle الجواب — حل مفصل خطوة بخطوة
hourglass_top
🔒
الحل الكامل متاح للمشتركين
اشترك في أرشيف الأسئلة لعرض هذا الحل وآلاف الحلول المفصلة خطوة بخطوة من معلمين معتمدين.