تم الحل ✓
categoryهندسة صناعية وإنتاج
schoolبكالوريوس
event_available2026-07-14
السؤال
Transcribed Image Text:
CASE
Once the
sales resulted
$19 million in
in 1987 to 55
In the d
growth. By 1
SEITZ CORPORATION: PRODUCING QUALITY GEAR-DRIVEN
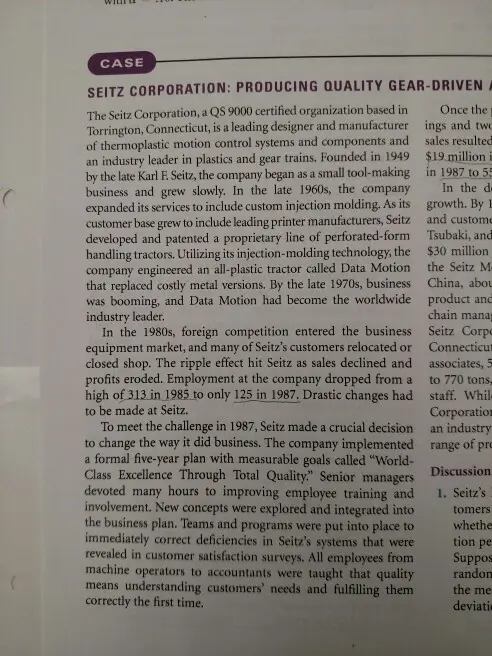
The Seitz Corporation, a QS 9000 certified organization based in
Torrington, Connecticut, is a leading designer and manufacturer ings and two
of thermoplastic motion control systems and components and
an industry leader in plastics and gear trains. Founded in 1949
by the late Karl F. Seitz, the company began as a small tool-making
business and grew slowly. In the late 1960s, the company
expanded its services to include custom injection molding. As its
customer base grew to include leading printer manufacturers, Seitz
developed and patented a proprietary line of perforated-form
handling tractors. Utilizing its injection-molding technology, the
company engineered an all-plastic tractor called Data Motion
that replaced costly metal versions. By the late 1970s, business
was booming, and Data Motion had become the worldwide
industry leader.
In the 1980s, foreign competition entered the business
equipment market, and many of Seitz's customers relocated or
closed shop. The ripple effect hit Seitz as sales declined and
profits eroded. Employment at the company dropped from a
high of 313 in 1985 to only 125 in 1987. Drastic changes had
to be made at Seitz.
To meet the challenge in 1987, Seitz made a crucial decision
to change the way it did business. The company implemented
a formal five-year plan with measurable goals called "World-
Class Excellence Through Total Quality." Senior managers
devoted many hours to improving employee training and
involvement. New concepts were explored and integrated into
the business plan. Teams and programs were put into place to
immediately correct deficiencies in Seitz's systems that were
revealed in customer satisfaction surveys. All employees from
machine operators to accountants were taught that quality
means understanding customers' needs and fulfilling them
correctly the first time.
and custome
Tsubaki, and
$30 million
the Seitz M-
China, abou
product and
chain manag
Seitz Corpo
Connecticut
associates, 5
to 770 tons,
staff. While
Corporation
an industry
range of pro
Discussion
1. Seitz's
tomers.
whethe
tion pe
Suppos
randon
the me
deviatio
psychiatric
hypothesis
tal database
is a significant difference between households in a metro
area and households outside metro areas in annual food
spending. Let a = .01.
ALITY GEAR-DRIVEN AND LINEAR-MOTION PRODUCTS
on based in
anufacturer
onents and
Hed in 1949
ool-making
company
ding. As its
Eurers, Seitz
rated-form
nology, the
ta Motion
s, business
worldwide
e business
located or
lined and
ed from a
anges had
l decision
lemented
"World-
managers
ning and
rated into
o place to
that were
yees from
Once the program started, thousands of dollars in cost sav-
ings and two new products generating almost $1 million in
sales resulted. Annual sales grew from $10.8 million in 1987 to
$19 million in 1990, Seitz's customer base expanded from 312
in 1987 to 550 at the end of 1990.
In the decade of the 1990s, Seitz continued its steady
growth. By 1999, Seitz was shipping products to 28 countries,
and customers included Xerox, Hewlett Packard, Canon, U.S.
Tsubaki, and many more worldwide. By 1998, sales topped the
$30 million mark. In January 2000, the company established
the Seitz Motion Control Systems Co., Ltd., in Changzhou,
China, about 150 miles northwest of Shanghai, to provide
product and tooling design engineering, sourcing and supply
chain management services, and contract manufacturing. The
Seitz Corporation headquarters is located in Torrington,
Connecticut, in an 80,000-square-foot facility with over 150
associates, 50 molding machines ranging in size from 35 tons
to 770 tons, an in-house tooling department, and a corporate
staff. While the primary core competency of the Seitz
Corporation is rotary and linear motion control, making them
an industry leader in plastics and gear trains, Seitz offers a full
range of product design and tooling services.
Discussion
1. Seitz's list of several hundred business-to-business cus-
tomers continues to grow. Managers would like to know
whether the average dollar amount of sales per transac-
tion per customer has changed from last year to this year.
Suppose company accountants sampled 20 customers
from this year's files and determined that the mean sales
per customer for this sample was $2,450, with a standard
poydeviation of $540. Analyze these data and summarize
your findings for managers. Explain how this information
can be used by decision makers. Assume that sales per
customer are normally distributed.
2. One common approach to measuring a company's quality
is through the use of customer satisfaction surveys.
Suppose in a random sample, Seitz's customers are asked
whether the plastic tractor produced by Seitz has out-
standing quality (Yes or No). Assume Seitz produces these
tractors at two different plant locations and that the tractor
customers can be divided according to where their trac-
tors were manufactured. Suppose a random sample of
45 customers who bought tractors made at plant 1 results
in 18 saying the tractors have excellent quality and a ran-
dom sample of 51 customers who bought tractors made
at plant 2 results in 12 saying the tractors have excellent
quality. Use a confidence interval to express the estimated
difference in population proportions of excellent ratings
between the two groups of customers. Does it seem to
matter which plant produces the tractors in terms of the
quality rating received from customers? What would you
report from these data?
3. Suppose the customer satisfaction survey included a
question on the overall quality of Seitz measured on a
scale from 0 to 10 where higher numbers indicate greater
quality. Company managers monitor the figures from
year to year to help determine whether Seitz is improving
customers' perceptions of its quality. Suppose random
samples of the responses from 2012 customers and 2013
Two-Samp
Two-samp-
2012
2013
Differen
Estimat-
95% CI
T-Test
T-value
4. Suppose
millime
made in
control
ence in
Assume
results
51,50,
from t
measur
a test t
fers be
contro
this te
of the
means
eters a
Use a confidence interval to express the estimated
difference in population proportions of excellent ratings
between the two groups of customers. Does it seem to
matter which plant produces the tractors in terms of the
quality rating received from customers? What would you
report from these data?
3. Suppose the customer satisfaction survey included a
question on the overall quality of Seitz measured on a
scale from 0 to 10 where higher numbers indicate greater
quality. Company managers monitor the figures from
year to year to help determine whether Seitz is improving
customers' perceptions of its quality. Suppose random
samples of the responses from 2012 customers and 2013
customers are taken and analyzed on this question, and
the following Minitab analysis of the data is the result.
Help managers interpret this analysis so that comparisons
can be made between 2012 and 2013. Discuss the samples,
the statistics, and the conclusions.
Assume th
results in
51,50, 48.
from the
measurer
a test to
fers betw
control
this test
of thes
means
eters a
Source: Ada
itiveness: R
by Warner
and the U
Enterprise
http://ww
so no
EXCEL
USING THE COMPUTER
for
check_circle الجواب — حل مفصل خطوة بخطوة
hourglass_top
🔒
الحل الكامل متاح للمشتركين
اشترك في أرشيف الأسئلة لعرض هذا الحل وآلاف الحلول المفصلة خطوة بخطوة من معلمين معتمدين.