تم الحل ✓
categoryإحصاء
schoolبكالوريوس
event_available2026-07-14
السؤال
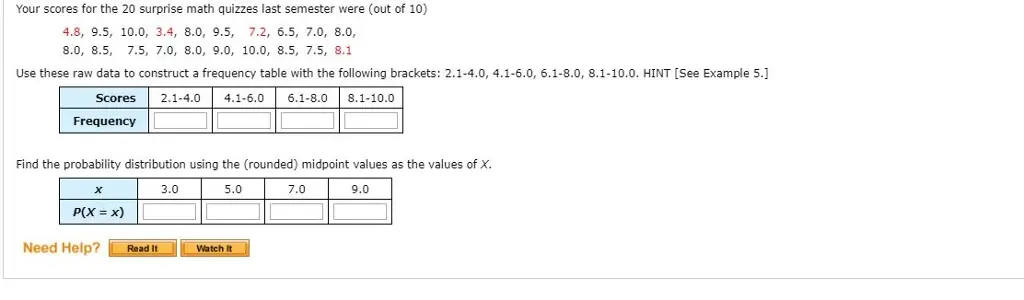
Transcribed Image Text:
Your scores for the 20 surprise math quizzes last semester were (out of 10)
4.8, 9.5, 10.0, 3.4, 8.0, 9.5, 7.2, 6.5, 7.0, 8.0,
8.0, 8.5, 7.5, 7.0, 8.0, 9.0, 10.0, 8.5, 7.5, 8.1
Use these raw data to construct a frequency table with the following brackets: 2.1-4.0, 4.1-6.0, 6.1-8.0, 8.1-10.0. HINT [See Example 5.]
Scores
Frequency
2.1-4.0
4.1-6.0
6.1-8.0
8.1-10.0
Find the probability distribution using the (rounded) midpoint values as the values of X.
x
3.0
5.0
P(X = x)
Need Help? Read It
Watch It
7.0
9.0
check_circle الجواب — حل مفصل خطوة بخطوة
hourglass_top
🔒
الحل الكامل متاح للمشتركين
اشترك في أرشيف الأسئلة لعرض هذا الحل وآلاف الحلول المفصلة خطوة بخطوة من معلمين معتمدين.