تم الحل ✓
categoryهندسة بيئية
schoolبكالوريوس
event_available2026-07-13
السؤال
Transcribed Image Text:
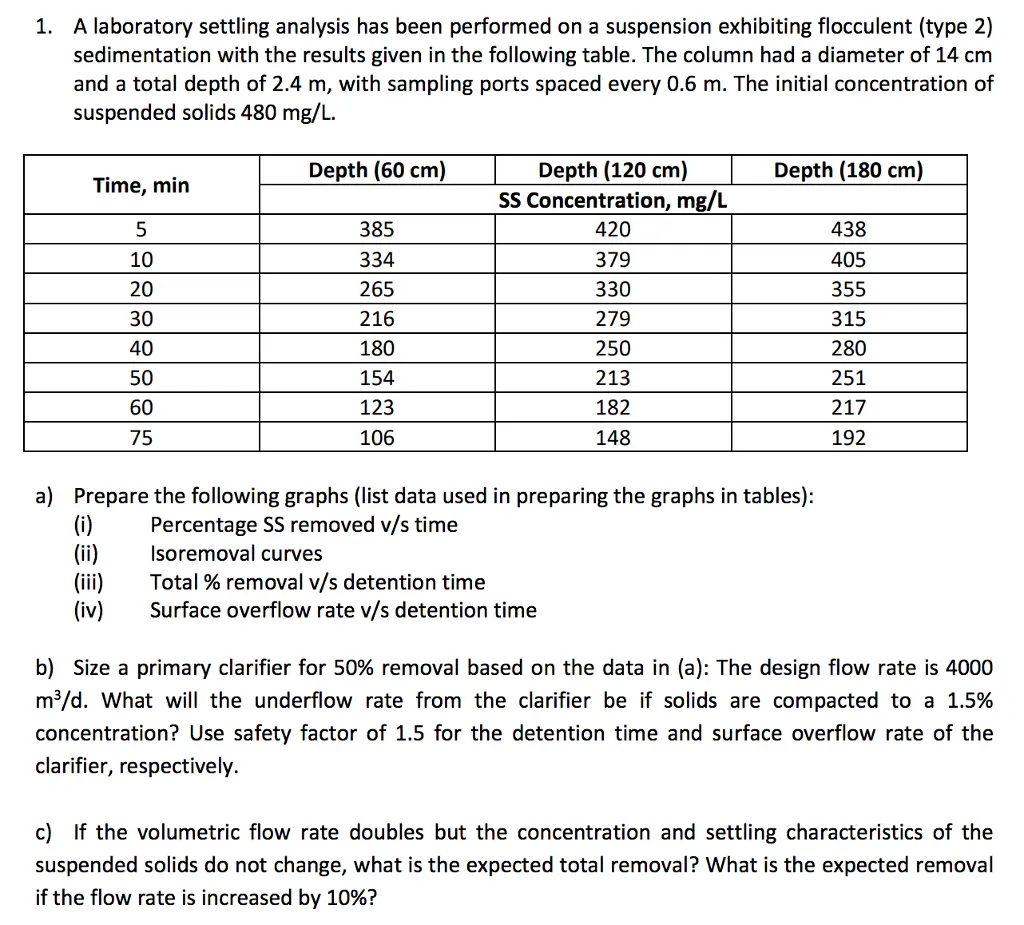
1. A laboratory settling analysis has been performed on a suspension exhibiting flocculent (type 2)
sedimentation with the results given in the following table. The column had a diameter of 14 cm
and a total depth of 2.4 m, with sampling ports spaced every 0.6 m. The initial concentration of
suspended solids 480 mg/L.
Time, min
Depth (60 cm)
Depth (120 cm)
SS Concentration, mg/L
Depth (180 cm)
5
385
420
438
10
334
379
405
20
265
330
355
30
216
279
315
40
180
250
280
50
154
213
251
60
123
182
217
75
106
148
192
a) Prepare the following graphs (list data used in preparing the graphs in tables):
Percentage SS removed v/s time
Isoremoval curves
(iii)
Total % removal v/s detention time
(iv)
Surface overflow rate v/s detention time
b) Size a primary clarifier for 50% removal based on the data in (a): The design flow rate is 4000
m³/d. What will the underflow rate from the clarifier be if solids are compacted to a 1.5%
concentration? Use safety factor of 1.5 for the detention time and surface overflow rate of the
clarifier, respectively.
c) If the volumetric flow rate doubles but the concentration and settling characteristics of the
suspended solids do not change, what is the expected total removal? What is the expected removal
if the flow rate is increased by 10%?
check_circle الجواب — حل مفصل خطوة بخطوة
hourglass_top
🔒
الحل الكامل متاح للمشتركين
اشترك في أرشيف الأسئلة لعرض هذا الحل وآلاف الحلول المفصلة خطوة بخطوة من معلمين معتمدين.