تم الحل ✓
categoryأحياء
schoolبكالوريوس
event_available2026-07-13
السؤال
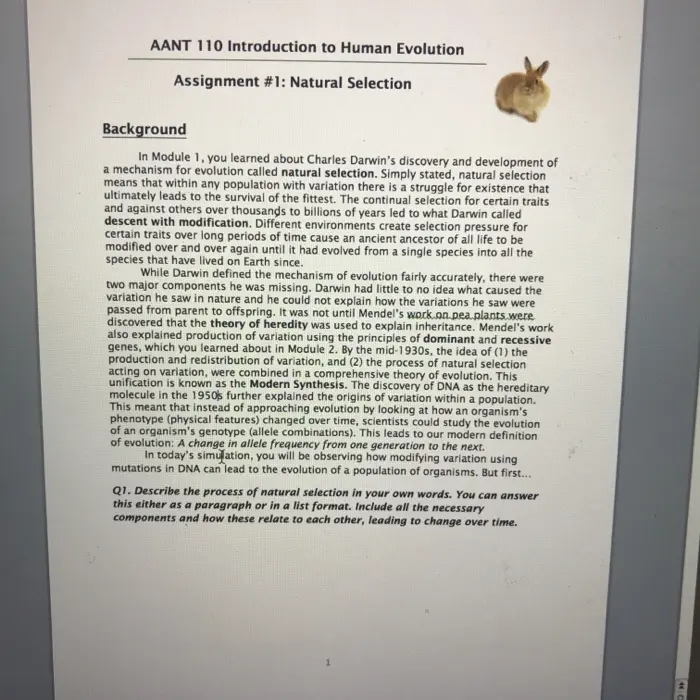
Transcribed Image Text:
AANT 110 Introduction to Human Evolution
Assignment #1: Natural Selection
Background
In Module 1, you learned about Charles Darwin's discovery and development of
a mechanism for evolution called natural selection. Simply stated, natural selection
means that within any population with variation there is a struggle for existence that
ultimately leads to the survival of the fittest. The continual selection for certain traits
and against others over thousands to billions of years led to what Darwin called
descent with modification. Different environments create selection pressure for
certain traits over long periods of time cause an ancient ancestor of all life to be
modified over and over again until it had evolved from a single species into all the
species that have lived on Earth since.
While Darwin defined the mechanism of evolution fairly accurately, there were
two major components he was missing. Darwin had little to no idea what caused the
variation he saw in nature and he could not explain how the variations he saw were
passed from parent to offspring. It was not until Mendel's work on pea plants.were
discovered that the theory of heredity was used to explain inheritance. Mendel's work
also explained production of variation using the principles of dominant and recessive
genes, which you learned about in Module 2. By the mid-1930s, the idea of (1) the
production and redistribution of variation, and (2) the process of natural selection
acting on variation, were combined in a comprehensive theory of evolution. This
unification is known as the Modern Synthesis. The discovery of DNA as the hereditary
molecule in the 1950s further explained the origins of variation within a population.
This meant that instead of approaching evolution by looking at how an organism's
phenotype (physical features) changed over time, scientists could study the evolution
of an organism's genotype (allele combinations). This leads to our modern definition
of evolution: A change in allele frequency from one generation to the next.
In today's simulation, you will be observing how modifying variation using
mutations in DNA can lead to the evolution of a population of organisms. But first...
Q1. Describe the process of natural selection in your own words. You can answer
this either as a paragraph or in a list format. Include all the necessary
components and how these relate to each other, leading to change over time.
C
Experiment 1
In this experiment you will be examining the effect of a recessive mutation that
changes the color of the organism, introduces variation in the population, and alters
how it avoids predators.
Q2. Prediction: Read through the experiment. Then in the space below hypothesize
how the recessive mutation for brown fur will affect the evolution of this bunny
population over the next 10 generations. When writing hypotheses, scientists use a
common format: If, then. Example: If a plant receives fertilizer, then it
will grow bigger. In this case, I would also like you to give a reason for your
hypothesis (because...).
2
Step 1: When you are ready to start your first experiment make sure the environment is
set to "equator" then click the "add a friend" button in the lower left-hand corner of the
environment. This will start the simulation. Watch the generation bar, let it run down
once, and then hit pause. Record the data from the graph for generation two in data
table 1. This should be when your first pair of bunnies has reproduced once.
Step 2: Once you've recorded the data, click on "Brown fur" in the add mutation section
of the simulator. Using the edit genes section of the simulator change brown fur to a
recessive trait.
Step 3. Start the simulation and let it run for two more generations. At this point pause
the simulation and use the graph to fill in generation 4 data in data table 1. Note: the
generation bar does not have to run down all the way for the second generation. Your
population bars should have four steps indicating increasing generations four times.
Step 4. Now add wolves as a selection factor and start the simulation. Let the
simulation run for three more generations. Hit pause and collect data for generation 7
on data table 1.
Bause the
HO
Step 5. Click play and let the simulation run for three more generations. Pause the
simulation and record the data for generation 10 in data table 1.
Data table 1
Generation
Graphical Data
Percentage calculations
Number of
number
Brown
Number of
White
% Brown
% White
Total
Rabbits
Rabbits
2
4
7
10
Analysis:
Calculate the percentage of each color of rabbit using the following method:
% Brown rabbit
% White rabbit
(Brown rabbits / Total rabbits) X 100
100% -% brown rabbits.
Q3. Briefly explain how the brown fur mutation affected the allele frequency of
the population. Be sure to use your data in this explanation.
Q4. Does the data in the table above support the hypothesis for this experiment?
Be sure to use your data in an explanation of why the data does or does not
support your hypothesis.
I
Experiment 2
In this experiment you will be examining the effect of a dominant mutation that affects
how the rabbits obtain food.
Q5. Prediction: Read through the experiment. Then in the space below hypothesize
how the dominant mutation for long teeth will affect the evolution of this bunny
C
Q5. Prediction: Read through the experiment. Then in the space below hypothesize
how the dominant mutation for long teeth will affect the evolution of this bunny
population over the next 10 generations. (Remember....if, then, because
statements)
Step 1. Click the reset all button in the lower right hand corner of the simulator.
Step 2. When you are ready to start your second experiment click on the "add a friend"
button in the lower left hand corner of the environment. This will start the simulation.
Watch the generation bar, let it run twice, then hit pause. Record the data from the
graph for generation two in data table 2.
Step 3. Once you've recorded the data click on "long teeth" in the add mutation section
of the simulator. This mutation should already be designated as a dominant trait but
check the edit genes section of the simulator to be sure.
Step 4. Start the simulation and let it run for two more generations. At this point,
pause the simulation and use the graph to fill in generation 4 data in data table 2.
Step 5. Now add food as a selection factor and start the simulation. Let the simulation
run for three more generations. Hit pause and collect the data for generation 7 on data
table 2.
Step 6. Click play and let the simulation run for three more generations. Pause the
simulation and record the data for generation 10 in data table 2.
Data table 2
Generation
number
Number of
Normal teeth
Graphical Data
Number of
Long teeth
Total
2
4
7
10
Analysis:
Percentage calculations
% Normal
% Long Tooth
Tooth Rabbits
Rabbits
I
HON
Analysis:
Calculate the percentage of each tooth type using the following method:
% Long tooth rabbit (Long tooth rabbits / Total rabbits) X 100
% Normal tooth rabbit - 100% -% Long tooth rabbits.
Q6. Briefly explain how this change in DNA affected the allele frequency of the
population. Be sure to use your data in this explanation.
Q7. Does the data in the table above support the hypothesis for this experiment?
Be sure to use your data in an explanation of why the data does or does not
support your hypothesis.
Experiment 3
In this experiment you will be examining the effect of a dominant mutation that
changes the length of the rabbit's tail. Your job in this simulation is to determine
whether or not having a longer tail gives the rabbits an advantage (is a favorable trait)
when trying to escape predators.
Q8. Prediction: Read through the experiment. Then in the space below hypothesize
how the dominant mutation for a long tail will affect the evolution of this bunny
population over the next 10 generations. (Remember... if, then, because
statements)
Step 1. Click the reset all button in the lower right hand corner of the simulator.
5
Step 2. When you are ready to start your third experiment click on the "add a friend"
button in the lower left hand corner of the environment. This will start the simulation.
Watch the generation bar, let it run twice, then hit pause. Record the data from the
graph for generation two in data table 3.
I
Step 3. Once you've recorded the data click on "long tail" in the add mutation section
of the simulator. This mutation should already be designated as the dominant trait but
check the edit genes section of the simulator to be sure.
Step 4. Start the simulation and let it run for two more generations. At this point pause
the simulation and use the graph to fill in generation 4 data in data table 3.
Step 5. Now add wolves as a selection factor and start the simulation. Let the
Мон
ans
11
ABC A A
AaBbCcDdEe
A
Aa
Normal
Text Box
Themes
7
Step 5. Now add wolves as a selection factor and start the simulation. Let the
simulation run for three more generations. Hit pause and collect the data for
generation 7 on data table 3.
Step 6. Click play and let the simulation run for three more generations. Pause the
simulation and record the data for generation 10 in data table 3.
Data table 3
Generation
number
Number of
Short Tail
Graphical Data
Number of
Long Tail
Total
% Short Tail
Rabbits
Percentage calculations
% Long tail
Rabbits
2
4
7
10
Analysis:
Calculate the percentage of each tail type using the following method:
% Short tail rabbit (Short tail rabbits/Total rabbits) X 100
% Long tail rabbit -100% -% short tail rabbits.
Q9. Briefly explain how this change in DNA affected the allele frequency of the
population. Be sure to use your data in this explanation.
Q10. Does the data in the table above support the hypothesis for this experiment?
Be sure to use your data in an explanation of why the data does or does not
support your hypothesis.
I
Discussion Questions:
Use your data, your knowledge of evolution, and genetics to answer the questions that
follow.
Q11. Given the current definition of evolution being a change in allele frequency
over time, did any of the mutations above fail to cause the population to evolve?
If so which one? Use your data to explain how you know.
Q12. Predict what would have happened in simulation 1 if you had switched the
environment from equator to arctic. Do you think the brown rabbits could have
been completely bred out of the population like the white ones may have been in
simulation 1? Why or why not?
Q13. In simulation three there should have been very little change in the
percentage of each type of rabbit. Why did the allele frequencies not change as
drastically in this simulation as they did in the other two?
Q14. Compare your data from simulation 1 and simulation 2. In simulation 1 the
mutation was recessive; in simulation 2 the mutation was dominant. What was
different about how these two populations evolved after the mutation? Did being
the dominant form of the trait insure that it would be selected for?
Q15. The mutations you made were in reality small changes in the DNA. Briefly
explain how a small change in DNA can cause such a huge evolutionary shift
within a population.
Print Layout View
Sec 1 Pages:
7 of 7
Words: 264 of 2002
100%
check_circle الجواب — حل مفصل خطوة بخطوة
hourglass_top
🔒
الحل الكامل متاح للمشتركين
اشترك في أرشيف الأسئلة لعرض هذا الحل وآلاف الحلول المفصلة خطوة بخطوة من معلمين معتمدين.