تم الحل ✓
categoryفيزياء
schoolبكالوريوس
event_available2026-07-13
السؤال
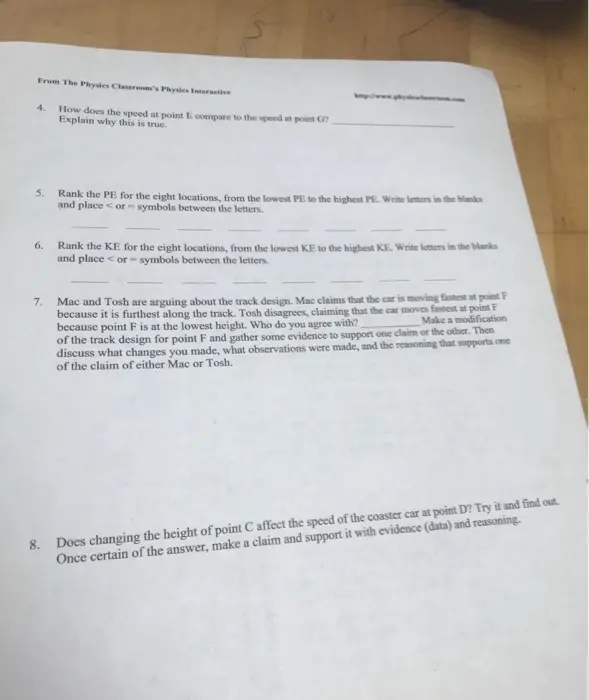
Transcribed Image Text:
From The Physics Classroom's Physics Interactive
4.
How does the speed at point E compare to the speed at point G?
Explain why this is true.
5. Rank the PE for the eight locations, from the lowest PE to the highest PE. Write letters in the blanks
and place or symbols between the letters.
6.
7.
Rank the KE for the eight locations, from the lowest KE to the highest KE. Write letters in the blanks
and place or symbols between the letters.
Mac and Tosh are arguing about the track design. Mac claims that the car is moving fastest at point F
because it is furthest along the track. Tosh disagrees, claiming that the car moves fastest at point F
Make a modification
because point F is at the lowest height. Who do you agree with?
of the track design for point F and gather some evidence to support one claim or the other. Then
discuss what changes you made, what observations were made, and the reasoning that supports one
of the claim of either Mac or Tosh.
8. Does changing the height of point C affect the speed of the coaster car at point D? Try it and find out.
Once certain of the answer, make a claim and support it with evidence (data) and reasoning.
From The Physics Classroo
[Absent]
Roller Coasters and Energy
Purpose: To investigate energy relationships for a roller coaster car.
Getting Ready: Navigate to the Roller Coaster Model in the Physics Interactives section of The Physics
Classroom website:
http://www.physicsclassroom.com/Physics-Interactives/Work-and-Energy/Roller-Coaster-Model
Path:
physicsclassroom.com -> Physics Interactives-> Work and Energy-Roller Coaster Model
Once the Interactive opens, get acquainted with how it functions. Know how to Start, Pause, Step, and
Reset the simulation. Observe the three different tabs at the top of the simulation for toggling between
Ramp, Loop, and Bumps. Observe that each track design can be further modified by dragging a grey
circle to a different position. Experiment with the three controls for showing the Velocity vector and
Force vectors and toggling Track Drag on and off. Once acquainted with the program, select the Ramp
button to reset the simulation to default settings and then perform the following studies:
Section 1: Basic Energy Relationships
1. Click/tap the Start button and observe the motion. View the bar
charts and the velocity value as the coaster car moves. Complete
the following paragraph by entering total mechanical energy
(ME), kinetic energy (KE), and potential energy (PE). The
labeled locations refer to the graphic at the right.
As the coaster car rolls down the track from A to E, the
values decrease and the
increase and the
value
values remain constant. The
is greatest at point A and smallest at point E.
is smallest at point A and largest
However, the
at point E.
Section 2: Hill Design
2. Click/tap on the Bumps tab at the top of the
Interactive. Then drag the grey circles to modify the
track so that it looks like the track design at the right.
Pay attention to the background grid to help with the
design. Note that Dot G is at the same height as Dot E;
make sure that the same is true of your final design.
3. Run the simulation. Does the coaster car travel as high
as point H?
Give an explanation for why
it does or doesn't reach point H.
H
B
D
F
G
check_circle الجواب — حل مفصل خطوة بخطوة
hourglass_top
🔒
الحل الكامل متاح للمشتركين
اشترك في أرشيف الأسئلة لعرض هذا الحل وآلاف الحلول المفصلة خطوة بخطوة من معلمين معتمدين.