تم الحل ✓
categoryإدارة أعمال
schoolبكالوريوس
event_available2026-07-13
السؤال
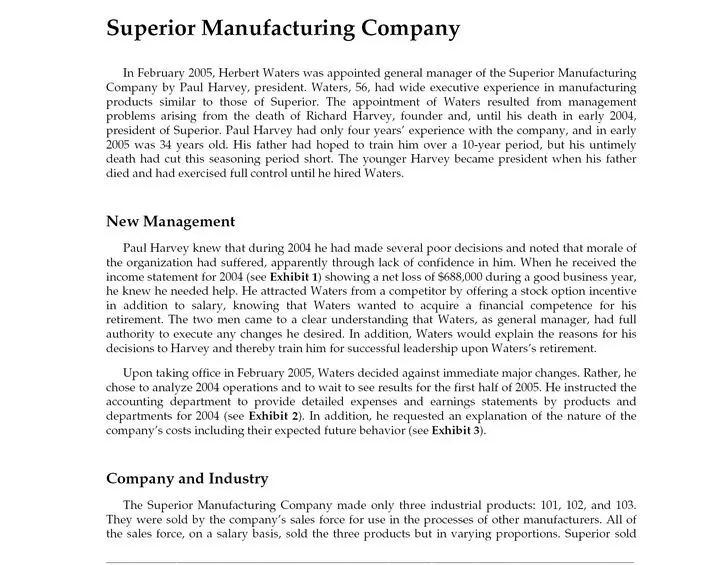
Transcribed Image Text:
Superior Manufacturing Company
In February 2005, Herbert Waters was appointed general manager of the Superior Manufacturing
Company by Paul Harvey, president. Waters, 56, had wide executive experience in manufacturing
products similar to those of Superior. The appointment of Waters resulted from management
problems arising from the death of Richard Harvey, founder and, until his death in early 2004,
president of Superior. Paul Harvey had only four years' experience with the company, and in early
2005 was 34 years old. His father had hoped to train him over a 10-year period, but his untimely
death had cut this seasoning period short. The younger Harvey became president when his father
died and had exercised full control until he hired Waters.
New Management
Paul Harvey knew that during 2004 he had made several poor decisions and noted that morale of
the organization had suffered, apparently through lack of confidence in him. When he received the
income statement for 2004 (see Exhibit 1) showing a net loss of $688,000 during a good business year,
he knew he needed help. He attracted Waters from a competitor by offering a stock option incentive
in addition to salary, knowing that Waters wanted to acquire a financial competence for his
retirement. The two men came to a clear understanding that Waters, as general manager, had full
authority to execute any changes he desired. In addition, Waters would explain the reasons for his
decisions to Harvey and thereby train him for successful leadership upon Waters's retirement.
Upon taking office in February 2005, Waters decided against immediate major changes. Rather, he
chose to analyze 2004 operations and to wait to see results for the first half of 2005. He instructed the
accounting department to provide detailed expenses and earnings statements by products and
departments for 2004 (see Exhibit 2). In addition, he requested an explanation of the nature of the
company's costs including their expected future behavior (see Exhibit 3).
Company and Industry
The Superior Manufacturing Company made only three industrial products: 101, 102, and 103.
They were sold by the company's sales force for use in the processes of other manufacturers. All of
the sales force, on a salary basis, sold the three products but in varying proportions. Superior sold
throughout New England and was one of eight companies with similar products. Several of its
competitors were larger and manufactured a larger variety of products than did Superior. The
dominant company was the Samra Company, which operated a branch plant in the company's
market area. Customarily, the Samra Company announced prices annually, and the other producers
followed suit.
Price cutting was rare, and the only variance from quoted selling prices took the form of cash
discounts. In the past, attempts at price cutting had followed a consistent pattern: all competitors met
the price reduction, and the industry as a whole sold about the same quantity but at the lower prices.
This continued until the Samra Company, with its strong financial position, again stabilized the
situation following a general recognition of the failure of price cutting. Furthermore, because sales
were to industrial buyers and because the products of different manufacturers were very similar,
Waters was convinced Superior could not individually raise prices without suffering substantial
volume declines.
During 2004, Superior's share of industry sales was 12% for type 101, 8% for 102, and 10% for 103.
The industrywide quoted selling prices were $24.50, $25.80, and $27.50 per 100 pounds of product,
respectively.
Manufacturing Strategy
Superior's manufacturing strategy was based on the "dedicated factory" concept. That is, each of
the three products was produced in its own factory within the total factory complex. The three
product factories were referred to as 101 Factory, 102 Factory, and 103 Factory. Each of these product
factories was horizontally integrated beginning with receiving and extending through raw material
storage, production-process facilities, finished-product inventory, and shipping. In addition, each
product factory had a dedicated direct labor force, which for accounting purposes included hourly
workers, shift managers, and other manufacturing-related personnel assigned to each product
factory. Indirect labor "floated" between product factories as needed.
Typically, the Superior manufacturing facilities operated below capacity.
Cost System
The Superior Manufacturing Company maintained a simple cost system. It was used for strategic
planning, product-line decisions, identifying manufacturing process-improvement opportunities,
profitability analysis, performance evaluation, cost control, and inventory valuation purposes.
Management's goal was to assign all of the company's costs to each of the three products in a way
that would lead to the most useful product costs for the cost system's various managerial purposes.
The cost system identified two categories of costs. The first category consisted of costs, such as
material costs, that could be tied directly to the manufacture of specific products. All other costs were
placed in the second category and referred to as indirect costs (see Exhibit 2).
The cost system accumulated direct and indirect costs at the product-factory level before
determining the individual product costs on a per unit basis. Since each of the three products was
sold in 100-pound bags, per unit costs were expressed in terms of 100 pounds of finished product.
The per unit cost was calculated by dividing the unit output into the respective product factory's total
cost. Total cost was the sum of the product factory's direct costs plus allocated indirect costs less an
allocated other-income amount. Allocated indirect costs included the company's interest cost related
to bank loans.
Costs designated as direct costs were assigned directly to the product factory in which they were
incurred. For example, the cost of materials used to manufacture product 101 in 101 Factory was
charged directly to the 101 Factory account. This material cost could be traced directly to 101 Factory
through material purchase and requisition orders.
Indirect costs were allocated to the product factories using a variety of allocation methods (see
Exhibit 2). For example, the total company rent expense ($5,324,000) was allocated to each product
factory based on its enclosed cubic space. Cubic space was selected as the allocation basis to capture
the fact that the production process for each of the three products included enclosed scrubber towers
that varied in height depending on the product produced. Using the cubic space as the allocation
base, the total company rent was charged as shown in Figure A to each product factory.
Figure A
Actual Rent Expense
Allocation Basis
(cubic space)
Total Company Rent
($5,324,000)
Allocated Rent
101 Factory
($1,872,000)
102 Factory
($1,570,000)
103 Factory
($1,882,000)
Source: Casewriter.
The allocated per 100-pound rent cost of each product was derived by dividing the unit output of
each product factory into the respective product factory's allocated rent.
A standard cost system was introduced in early 2005. It was used to value inventories, prepare
budgets, and analyze performance (see Exhibit 4). Next year's standard costs were last year's actual
per unit costs adjusted for anticipated cost changes. Since Superior's three products were each sold in
100-pound bags, per unit standards were expressed in terms of 100 pounds of finished product.
Drop 103?
To familiarize Paul Harvey with his methods, Waters sent copies of Exhibits 2 and 3 to Harvey,
and they discussed them. Harvey stated that he thought product 103 should be dropped immediately,
as it would be impossible to lower expenses on product 103 as much as $2.16 per 100 pounds. In
addition, he stressed the need for economies on product 102.
Waters relied on the authority arrangement Harvey had agreed to earlier and continued
production of the three products.
Midyear Results
In the first week of July 2005, Waters received from the accounting department the six months'
statement of cumulative standard costs including variances of total company actual costs from
standard (see Exhibit 4). It showed that the first half of 2005 had been a successful period.
In order to expedite the availability of interim-period results, Superior did not determine actual
product-line revenues, costs, and profits. Rather, product-line data was prepared using standard per
unit data and actual unit sales.
Reduce 101 Price?
During the latter half of 2005, the sales of the entire industry weakened. Even though Superior
retained its share of the market, its profit for the last six months was expected to be small. In
November 2005, the Samra Company announced a price reduction as of January 1, 2006 on product
101 from $24.50 to $22.50 per 100 pounds. This created a pricing problem for all its competitors.
Waters forecast that if Superior held to the $24.50 price during the first six months of 2006, the
company's unit sales would be 750,000. He felt that if it dropped its price to $22.50, the six months'
unit volume would be 1 million. Waters knew that competing managements anticipated a further
decline in activity. He thought a general decline in prices of all products was quite probable.
The accounting department reported that the standard costs in use would probably apply during
2006, with two exceptions: materials and supplies would be about 5% below the 2005 standard.
Waters and Harvey discussed the pricing problem. Harvey observed that even with the
anticipated decline in material and supply costs, a sales price of $22.50 would be below cost. Harvey
therefore wanted the $24.50 price to be continued, since he felt the company could not be profitable
while selling a key product below cost.
Questions
1. Based on the 2004 statement of profit and loss data (Exhibits 1 and 2), do you agree with
Waters's decision to keep product 103?
2. Should Superior lower as of January 1, 2006 its price of product 101? To what price?
3. Why did Superior improve profitability during the period January 1 to June 30, 2005? How
useful was the data in Exhibit 4 for the purpose of this analysis?
4. Why is it important that Superior has an effective cost system? What is your overall appraisal
of the company's cost system and its use in reports to management? List the strengths and
weaknesses of this system and its related reports for the purposes management uses the
system's output. What recommendations, if any, would you make to Waters regarding the
company's cost accounting system and its related reports?
Exhibit 1
Profit and Loss Statement for Year Ending December 31, 2004 (000)
Gross Sales
Cash Discount
Net Sales
Cost of Manufacturing
Manufacturing Profit
Less: Selling Expense
$18,383
General Administration
6,534
Depreciation
13.591
Operating Profit
Other Income
Net Profit before Interest
Less: Interest
Net Loss
Source: Casewriter.
$105,905
1,567
$104,338
65,251
$ 39,087
38,508
$ 579
205
$ 784
1,472
$ 688
Exhibit 2 Analysis of Profit and Loss by Products and Departments-Year Ended December 31, 2004 (thousands $ except per 100 lbs.)
Product 101
Product 102
Product 103
Classification
per 100 lbs.
per 100 lbs.
per 100 lbs.
Total
Direct
Indirect
Allocation Basis
Rent
$ 1,872
$.88
$ 1,570
$1.53
$ 1,882
$ 1.90
$5,324
X
Cubic space
Property Taxes
621
29
503
49
401
.40
1,525
X
Area
Property Insurance
5241
25
405
.39
534
.53
1,463
X
Value of equipment
Compensation Insurance
836
39
439
42
458
.46
1,733
X
Direct labor ($)
Direct Labor
12.937
6.06
6,107
5.92
6,879
6.97
25,921
Indirect Labor
4,413
2.07
2,124
2.06
2,309
2.33
8,846
X
Direct labor ($)
Power
220
.11
251
24
302
.31
773
X
Machine horsepower
Light & Heat
158
.07
130
.12
106
.10
394
X
Area
Building Service
109
.05
821
.08
75
.08
266
X
Area
Materials
7,641
3.59
4,716
4.58
4,851
4.91
17,208
Supplies
525
25
485
46
350
.36
1,360
Repairs
184
08
150
.15
104
.10
438
xxx
X
Total
$30,040
$14.09
$16,962
$16.44
$18,249
$18.45
$ 65,251
Selling Expense
9,100
4.27
4,582
4.44
4,701
4.76
18,383
X
$ value of sales
General Administrative
3,451
1.62
1,300
1.26
1,783
1.80
6,534
$ value of sales
Depreciation
5,659
2.65
4,274
4.16
3,658
3.70
13,591
X
Value of equipment
Interest
524
25
409
.39
539
.53
1,472
X
Value of equipment
Total Cost
$48,774
$22.88
$27,527
$26.69
$28,930
$29.24
$105,231
Less: Other Income
101
.04
53
.05
51
$48,673
$22.84
$27,474
$26.64
$28,879
.05
$29.19
205
X
$ value of sales
$105,026
Sales (Net)
51,672
24.24
25,996
25.23
26.670
27.03
104,338
Profit (Loss)
$2,999
$1.40
($1,478)
($ 1.41)
($2,209)
($ 2.16)
($ 688)
Unit Sales (100 lbs.)
2,132,191
1,029,654
986,974
Quoted Selling Price Per Unit
$24.50
$25.80
$27.50
Cash Discount Taken (% of
selling price)
1.08%
2.14%
1.74%
1.48%
Source:
Note:
Casewriter.
Figures may not add exactly because of rounding.
Exhibit 3 Accounting Department's Commentary on Costs
Direct Labor: Variable. Union shop at going community rates. No abnormal demands foreseen. It
may be assumed that direct labor dollars are an adequate measure of capacity utilization.
Compensation Insurance: Variable. Five percent of direct and indirect labor is an accurate estimate.
Materials: Variable. Exhibit 2 figures are accurate. Includes waste allowances. Purchases are at
market prices.
Power: Variable. Rates are fixed. Use varies with activity. Averages per Exhibit 2 are accurate.
Supplies: Variable. Exhibit 2 figures are accurate. Supplies bought at market prices.
Repairs: Variable. Varies as volume changes within normal operation range. Lower and upper limits
are fixed.
General Administrative, Selling Expense, Indirect Labor, Interest, and Other Income: These items
are almost nonvariable. They can be changed, of course, by management decision.
Cash Discount: Almost nonvariable. Average cash discounts taken are consistent from year to year.
Percentages in Exhibit 2 are accurate.
Light and Heat: Almost nonvariable. Heat varies slightly with fuel cost changes. Light a fixed item
regardless of level of production.
Property Taxes: Almost nonvariable. Under the lease terms Superior pays the taxes; assessed
valuations have been constant; the rate has risen slowly. Any change in the near future will be
small and independent of production volume.
Rent: Nonvariable. Lease has 12 years to run.
Building Service: Nonvariable. At normal business level, variances are small.
Property Insurance: Nonvariable. Three-year policy with fixed premium.
Depreciation: Nonvariable. Fixed dollar total.
Exhibit 4 Profit and Loss by Products and Departments at Standard and Total Company Variances from January 1 to June 30, 2005
(thousands $ except per 100 lbs.)
Product 101
Product 102
Product 103
Standard
Item
per 100 lbs.
Total at
Standard
Standard
per 100 lbs.
Total at
Standard
Standard
per 100 lbs.
Total at
Standard
Total
Standard
Total
Actual
Variances
+= Favorable
- Unfavorable.
Rent
$.88
$ 877
$1.53
$ 1,090
$ 1.90
$ 952
$2,919
$2,660
+259
Property Tax
29
289
.49
349
40
201
839
770
+69
Property Insurance
25
249
.39
278
.53
266
793
732
+61
Compensation Insurance
.39
389
.42
299
46
231
919
917
+2
Direct Labor
6.06
6,041
5.92
4,216
6.97
3,496
13,751
13,820
-69
Indirect Labor
2.07
2,063
2.06
1,467
2.33
1,168
4,698
4,485
+213
Power
.11
109
24
171
.31
155
435
432
+3
Light & Heat
.07
70
.12
85
.10
50
205
200
+5
Building Service
.05
50
.08
57
.08
40
147
107
+40
Materials
3.59
3,579
4.58
3,261
4.91
2,461
9,301
9.282
+19
Supplies
25
239
.46
328
.36
180
747
750
-3
Repairs
.08
79
.15
107
.10
50
236
251
-15
Total
$14.09
$14,034
$ 16.44
$11,708
$18.45
$9,248
$34,990
$34,406
+584
Selling Expense
4.27
4,257
4.44
3,162
4.76
2,386
9,805
9,830
-25
General Administrative
1.62
1,615
1.26
897
1.80
902
3,414
3,289
+125
Depreciation
2.65
2,642
4.16
2,962
3.70
1,855
7,459
6,817
+642
Interest
25
249
39
278
.53
266
793
730
+63
Total Cost
$22.88
$22,797
$26.69
$ 19,007
$29.24
$14,657
$56,461
$55,072
+1,389
Less: Other Income
.04
40
.05
36
.05
25
101
110
+9
$22.84
Actual Sales (net)
24.24
Profit (Loss)
$ 1.40
$22,757
24,164
$ 1,407
$26.64
25.23
($ 1.41)
$ 18,971
$29.19
$14,632
17,961
27.03
13,550
($1,010)
($ 2.16)
($1,082)
$56,360
55,675
($685)
$54,962
+1,398
55,675
$713
+1,398
Unit Sales (100 lbs.)
996,859
712,102
501,276
Source: Casewriter.
Actual unit sales times standard net revenue per unit.
Instructions for the Superior Mfg case
In your case memo answer question 2 from the Superior Manufacturing Company case using the additional data and other specific instructions below.
Herbert Waters wanted a more detailed understanding of the company's pricing options for product 101, so he commissioned a brand new sales forecast
to use in considering the product 101 price. In your response to question 2, use the prices and estimated sales quantities provided in Table 1 in place of the
sales quantities estimated in the paragraph immediately under "Reduce 101 Price?" in the case study. The extended sales forecast assumes competitors do
not match the price cut at $22.00 but rather follow Samra Corp. and price at $22.50.
Table 1: Expanded sales forecasts.
Price Sales forecast
$24.50
750,000
$24.00
812,500
$23.50
875,000
$23.00
900,000
$22.50
1,000,000
$22.00
1,125,000
Waters asks you to do your analysis two ways: (A) using table 1 as presented which assumes the competition prices at $22.50; and (B), assuming
competitors match the price cut to $22.00. In this second case, assume sales at $22.00 will be 1,000,000.
Your memo should consist of the memo header as usual, then exactly two paragraphs of recommendations/explanations, and additional tables or figures if
such additions help your explain your recommendations.
⚫ In the first paragraph offer a recommendation using assumption (A) above and provide enough explanation to convey a sense of your analysis and how it
supports your recommendation; in the second paragraph offer a recommendation using assumption (B) above and provide enough explanation to convey a
sense of your analysis and how it supports your recommendation.
In your memo, be as clear as you on your recommendations and on how the results of your analysis back up your recommendations.
A key here is, of course, identifying the relevant costs. Not all of the costs presented will vary with changes in output, so your challenge is to figure out just how to
sort through the costs to decide which are relevant to the question to be answered. Note that the classification of costs into "Direct" and "Indirect" is helpful but not
everything. Consider the information offered in Exhibit 3 in the case and how it relates to the question of relevant costs.
check_circle الجواب — حل مفصل خطوة بخطوة
hourglass_top
🔒
الحل الكامل متاح للمشتركين
اشترك في أرشيف الأسئلة لعرض هذا الحل وآلاف الحلول المفصلة خطوة بخطوة من معلمين معتمدين.