تم الحل ✓
categoryإحصاء
schoolبكالوريوس
event_available2026-07-13
السؤال
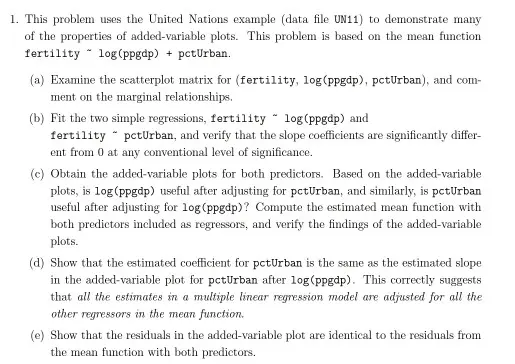
Transcribed Image Text:
1. This problem uses the United Nations example (data file UN11) to demonstrate many
of the properties of added-variable plots. This problem is based on the mean function
fertility
log (ppgdp) + pctUrban.
(a) Examine the scatterplot matrix for (fertility, log (ppgdp), pctUrban), and com-
ment on the marginal relationships.
(b) Fit the two simple regressions, fertility log (ppgdp) and
fertility pctUrban, and verify that the slope coefficients are significantly differ-
ent from 0 at any conventional level of significance.
(c) Obtain the added-variable plots for both predictors. Based on the added-variable
plots, is log (ppgdp) useful after adjusting for pctUrban, and similarly, is pctUrban
useful after adjusting for log (ppgdp)? Compute the estimated mean function with
both predictors included as regressors, and verify the findings of the added-variable
plots.
(d) Show that the estimated coefficient for pctUrban is the same as the estimated slope
in the added-variable plot for pctUrban after log (ppgdp). This correctly suggests
that all the estimates in a multiple linear regression model are adjusted for all the
other regressors in the mean function.
(e) Show that the residuals in the added-variable plot are identical to the residuals from
the mean function with both predictors.
check_circle الجواب — حل مفصل خطوة بخطوة
hourglass_top
🔒
الحل الكامل متاح للمشتركين
اشترك في أرشيف الأسئلة لعرض هذا الحل وآلاف الحلول المفصلة خطوة بخطوة من معلمين معتمدين.