تم الحل ✓
categoryإحصاء
schoolبكالوريوس
event_available2026-07-13
السؤال
Transcribed Image Text:
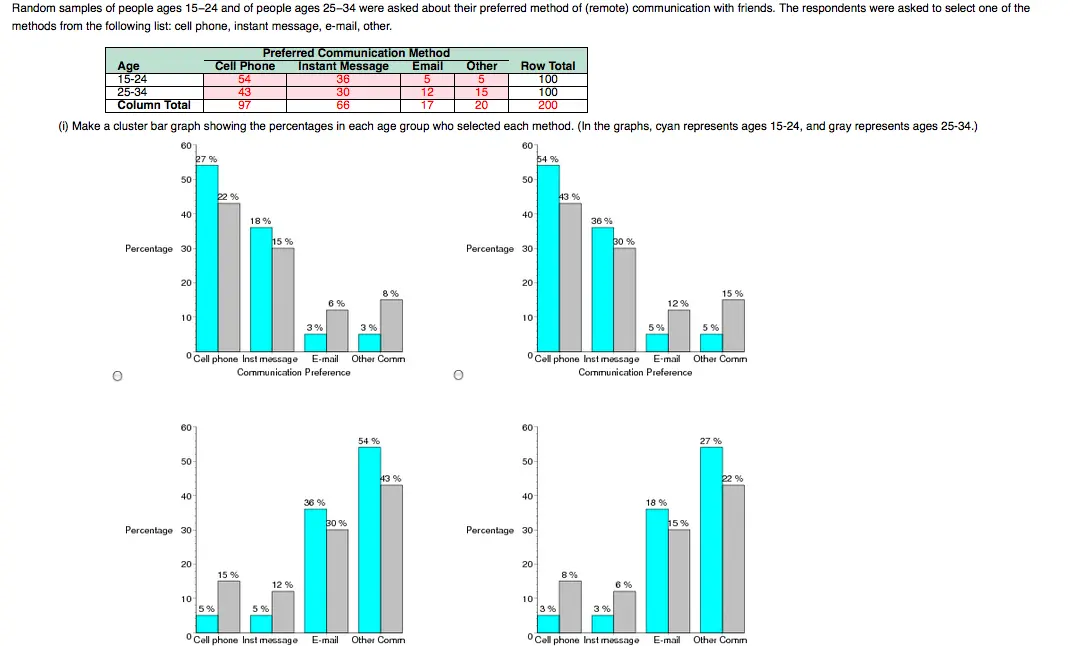
Random samples of people ages 15-24 and of people ages 25-34 were asked about their preferred method of (remote) communication with friends. The respondents were asked to select one of the
methods from the following list: cell phone, instant message, e-mail, other.
Age
15-24
25-34
Column Total
Preferred Communication Method
Cell Phone
Instant Message
Email
Other
Row Total
54
43
97
36
5
5
100
30
66
12
17
15
20
100
200
(i) Make a cluster bar graph showing the percentages in each age group who selected each method. (In the graphs, cyan represents ages 15-24, and gray represents ages 25-34.)
60
27 %
50
40
22%
Percentage 30-
20
10
18%
15%
8%
6%
3%
3%
0
Cell phone Inst message E-mail
Other Comm
Communication Preference
60
50
40
36%
30%
Percentage 30-
54 %
43 %
60
54 %
50
43 %
40
36%
30%
Percentage 30-
20
10
60
50
15%
12%
5%
5%
Cell phone Inst message
E-mail
Communication Preference
Other Comm
27 %
22 %
40
18 %
15%
Percentage 30
20
15%
12%
10
5%
5%
20
8%
10
3%
3%
Cell phone Inst message
E-mail Other Comm
O Cell phone Inst message
E-mail
Other Comm
(ii) Test whether the two populations share the same proportions of preferences for each type of communication method. Use a = 0.05.
(a) What is the level of significance?
State the null and alternate hypotheses.
○ H₁: Different proportion of communication preference for each age group.
H₁: Different proportion of communication preference for each age group.
O Ho: Same proportion of communication preference for each age group.
H₁: Different proportion of communication preference for each age group.
○ Ho: Different proportion of communication preference for each age group.
H₁: Same proportion of communication preference for each age group.
O Ho: Same proportion of communication preference for each age group.
H₁: Same proportion of communication preference for each age group.
(b) Find the value of the chi-square statistic for the sample. (Round the expected frequencies to at least three decimal places. Round the test statistic to three decimal places.)
Are all the expected frequencies greater than 5?
○ Yes
○ No
What sampling distribution will you use?
○ Student's t
O uniform
O chi-square
O normal
O binomial
What are the degrees of freedom?
(c) Find or estimate the P-value of the sample test statistic. (Round your answer to three decimal places.)
(d) Based on your answers in parts (a) to (c), will you reject or fail to reject the null hypothesis of independence?
O Since the P-value> a, we fail to reject the null hypothesis.
O Since the P-value> a, we reject the null hypothesis.
O Since the P-value sa, we reject the null hypothesis.
O Since the P-value sa, we fail to reject the null hypothesis.
(e) Interpret your conclusion in the context of the application.
O At the 5% level of significance, there is sufficient evidence to conclude that the proportion of age groups within each communication preference is not the same.
○ At the 5% level of significance, there is insufficient evidence to conclude that the proportion of age groups within each communication preference is not the same.
check_circle الجواب — حل مفصل خطوة بخطوة
hourglass_top
🔒
الحل الكامل متاح للمشتركين
اشترك في أرشيف الأسئلة لعرض هذا الحل وآلاف الحلول المفصلة خطوة بخطوة من معلمين معتمدين.