تم الحل ✓
categoryفيزياء
schoolبكالوريوس
event_available2026-07-13
السؤال
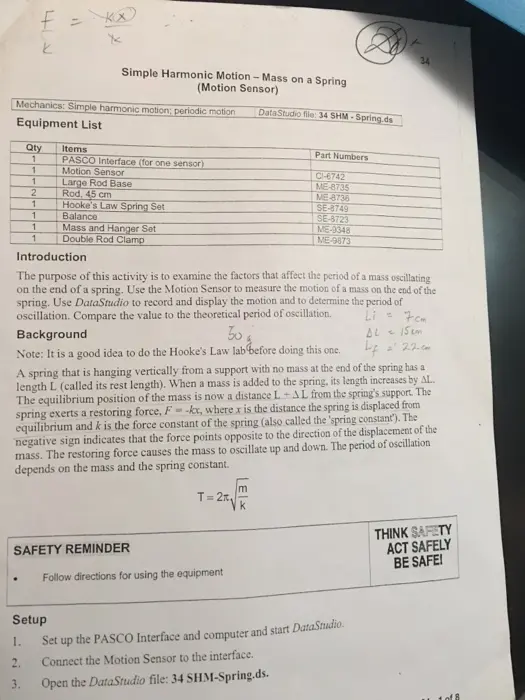
Transcribed Image Text:
Simple Harmonic Motion - Mass on a Spring
(Motion Sensor)
Mechanics: Simple harmonic motion; periodic motion
Equipment List
Data Studio file: 34 SHM-Spring.ds
34
Qty
Items
1
PASCO Interface (for one sensor)
1
Motion Sensor
1
Large Rod Base
2
Rod. 45 cm
1
Hooke's Law Spring Set
1
Balance
1
Mass and Hanger Set
1
Double Rod Clamp
Part Numbers
C-6742
ME-8735
ME-8736
SE-8749
SE-8723
ME-9348
ME-9873
Introduction
The purpose of this activity is to examine the factors that affect the period of a mass oscillating
on the end of a spring. Use the Motion Sensor to measure the motion of a mass on the end of the
spring. Use DataStudio to record and display the motion and to determine the period of
oscillation. Compare the value to the theoretical period of oscillation.
Background
50
Note: It is a good idea to do the Hooke's Law lab before doing this one.
Li=7cm
AL = 15km
L = 22
A spring that is hanging vertically from a support with no mass at the end of the spring has a
length L (called its rest length). When a mass is added to the spring, its length increases by AL.
The equilibrium position of the mass is now a distance L+AL from the spring's support. The
spring exerts a restoring force, F-kx, where x is the distance the spring is displaced from
equilibrium and k is the force constant of the spring (also called the 'spring constant). The
negative sign indicates that the force points opposite to the direction of the displacement of the
mass. The restoring force causes the mass to oscillate up and down. The period of oscillation
depends on the mass and the spring constant.
SAFETY REMINDER
m
T=2
k
.
Follow directions for using the equipment
Setup
Set up the PASCO Interface and computer and start DataStudio.
Connect the Motion Sensor to the interface.
1.
2.
3.
Open the DataStudio file: 34 SHM-Spring.ds.
THINK SAFETY
ACT SAFELY
BE SAFE!
1 of 8
•
34 SHM-Mass on a Spring
Mass of spring
Mass of hanger
Physics Experiment Manua
L of Spring
-7.79 = 0.00774
20-79012-09251
0.05m
The DataStudio file has graph displays of Position-Time and Velocity- Time. The
Motion Sensor is set to measure at 30 Hz.
0-07079
•
4.
23
3.
.
4.
Attach one of the support rods to the Large Rod Base.
5.
Measure the mass of the spring and record it
6.
7.
8.
Measure the mass of the hanger and a 0.050 kilogram mass
Record the value for Suspended Mass' for Run #1 in
kilograms.
Using a support rod and clamp, suspend the spring so that it
can move freely up-and-down. Put the mass hanger on the
end of the spring.
Place the Motion Sensor on the floor directly beneath the
mass hanger. Set the Range Select switch to the 'Person
(FAR) icon.
Procedure
Note: Have one person handle the apparatus and another person handle the computer. Stop
recording data before the cart hits the end stop.
1. Pull the mass down to stretch the spring. Release the mass. Let it oscillate a few times so
the mass hanger will move up-and-down without much side-to-side motion.
Click 'Start' to begin recording data.
Let the mass oscillate up-and-down for several seconds and then click 'Stop' to end data
recording.
The position curve should resemble a sine function. If it does not, check the alignment
between the Motion Sensor and the bottom of the mass hanger. The next section shows
how to analyze the data.
For Run # 2, add a 20-g (0.020-kg) mass to the mass hanger and record the suspended
mass. Repeat the data recording process.
012-09251
Physics Experiment Manual
34 SHM-Mass on a Spring
Analyze
I.
2.
Click the 'Zoom Select' tool. Use the tool to
highlight and expand the first three
maximum peaks of the curves.
Choose the 'Smart Tool' button. Move the
Smart Tool to the first peak in the plot of
position versus time. Move the cursor to the
bottom comer of the Smart Tool. A triangle
(called the "delta" tool) will appear. Drag
the delta'to the next peak. The delta X value.
is the period.
FAA A
0490
C494
414 0 4953
09200
3.
Record your measured period for Run #1.
0 49
4.
Move the Smart Tool to the next peak. Use
the delta tool to find the period between the second and third peaks. Record the period.
Average these values and record the value.
5.
6.
Repeat the procedure above for Run #2.
Use your results to answer the questions in the Lab Report section.
012-09251
Pha Exament Manual
34 SHM-Mass
Lab Report: Simple Harmonic Motion-Mass on a Spring
Name:
Data
Sketch your graph of Position versus Distance for Run 1
Data Table
Item
Suspended Mass
Mass of the spring
Spring Constant
Period (average)
RUN 2
AL
RUN
7-79
20g
N/A
8-1=1m
7cm
7cm
Run #1
mass of spring = 7.7
= 20g
mass of hanger
mass of manger + bought = 50
displacement = 22-7 = 15cm
Run #2 of Spung
7.7 kg 3.2 kg
20 kg 20 kg
Nim
S
Nim
S
"Value for k either found by doing Hooke's Law lab or provided by your instuctor.
Calculation
The spring you are using in this experiment is heavy enough that its mass cannot be
neglected. The spring itself is also oscillating. It is found from calculus techniques T=2
m
that one-third of the mass of the spring must be added to the suspended mass in
calculations using the equation in the background section. Calculate the total mass (suspended
mass plus effective mass of the spring). Calculate the period based on the spring constant and the
total mass. Calculate the percent difference.
Item
Effective mass of the spring (1/3 mass)
Total mass
Period (calculated)
Percent difference
PASCO
Run #1
Run #2
kg
kg
kg
kg
S
$
%
%
2004
34-5 of 8
Mass on a Spring
Physics Experiment Manual
012-09251
estions
Examine the graph of position-time and velocity-time. When the position is at an extreme
(farthest from zero), what is the value of the velocity?
2. When the velocity is at a maximum value (positive or negative), what is the position?
3.
How will the period change if you increase the mass but keep the spring constant the
same?
check_circle الجواب — حل مفصل خطوة بخطوة
hourglass_top
🔒
الحل الكامل متاح للمشتركين
اشترك في أرشيف الأسئلة لعرض هذا الحل وآلاف الحلول المفصلة خطوة بخطوة من معلمين معتمدين.