تم الحل ✓
categoryهندسة مدنية
schoolبكالوريوس
event_available2026-07-13
السؤال
Transcribed Image Text:
Σ
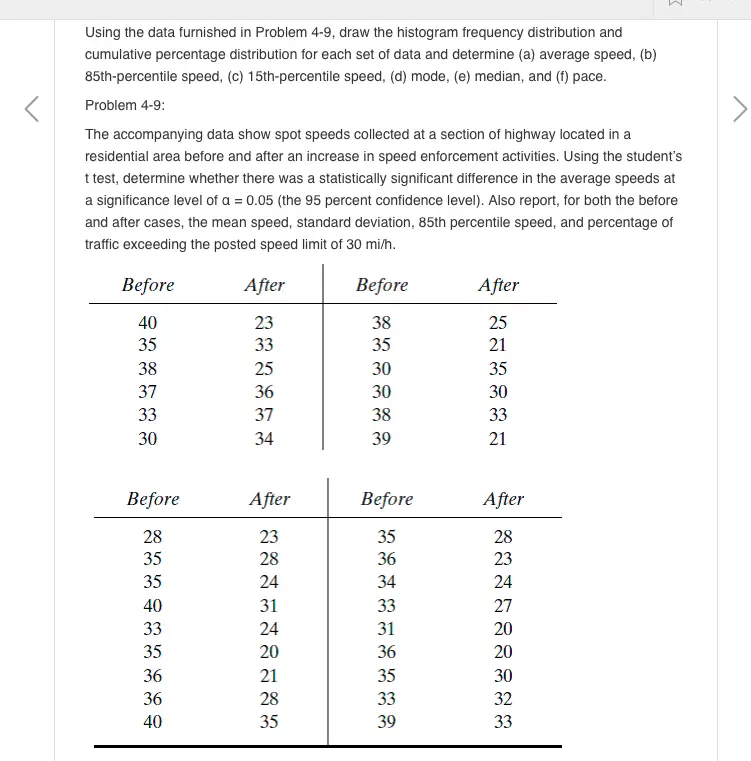
Using the data furnished in Problem 4-9, draw the histogram frequency distribution and
cumulative percentage distribution for each set of data and determine (a) average speed, (b)
85th-percentile speed, (c) 15th-percentile speed, (d) mode, (e) median, and (f) pace.
Problem 4-9:
The accompanying data show spot speeds collected at a section of highway located in a
residential area before and after an increase in speed enforcement activities. Using the student's
t test, determine whether there was a statistically significant difference in the average speeds at
a significance level of a = 0.05 (the 95 percent confidence level). Also report, for both the before
and after cases, the mean speed, standard deviation, 85th percentile speed, and percentage of
traffic exceeding the posted speed limit of 30 mi/h.
Before
After
Before
After
40
38
37
433333
23
38
25
35
33
35
25
30
36
30
37
38
30
34
39
23832
21
35
30
33
21
Before
After
Before
After
28
23
35
28
35
28
36
23
35
24
34
24
40
31
33
27
33
24
31
20
35
20
36
20
36
21
35
30
36
28
33
32
40
35
39
33
Using the data furnished in Problem 4-9, draw the histogram frequency distribution and
cumulative percentage distribution for each set of data and determine (a) average speed, (b)
85th-percentile speed, (c) 15th-percentile speed, (d) mode, (e) median, and (f) pace.
check_circle الجواب — حل مفصل خطوة بخطوة
hourglass_top
🔒
الحل الكامل متاح للمشتركين
اشترك في أرشيف الأسئلة لعرض هذا الحل وآلاف الحلول المفصلة خطوة بخطوة من معلمين معتمدين.