تم الحل ✓
categoryإحصاء
schoolبكالوريوس
event_available2026-07-13
السؤال
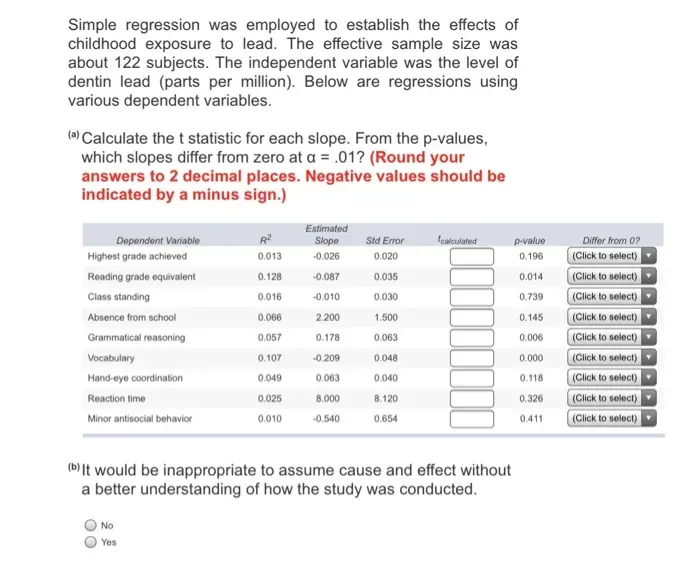
Transcribed Image Text:
Simple regression was employed to establish the effects of
childhood exposure to lead. The effective sample size was
about 122 subjects. The independent variable was the level of
dentin lead (parts per million). Below are regressions using
various dependent variables.
(a) Calculate the t statistic for each slope. From the p-values,
which slopes differ from zero at a = .01? (Round your
answers to 2 decimal places. Negative values should be
indicated by a minus sign.)
Estimated
Dependent Variable
R²
Slope
Std Error
Icalculated
p-value
Differ from 0?
Highest grade achieved
0.013
-0.026
0.020
0.196
(Click to select)
Reading grade equivalent
0.128
-0.087
0.035
0.014
(Click to select)
Class standing
0.016
-0.010
0.030
0.739
(Click to select)
Absence from school
0.066
2.200
1.500
0.145
(Click to select)
Grammatical reasoning
0.057
0.178
0.063
0.006
(Click to select)
Vocabulary
0.107
-0.209
0.048
0.000
(Click to select)
Hand-eye coordination
0.049
0.063
0.040
0.118
(Click to select)
Reaction time
0.025
8.000
8.120
0.326
(Click to select)
Minor antisocial behavior
0.010
-0.540
0.654
0.411
(Click to select)
(b) It would be inappropriate to assume cause and effect without
a better understanding of how the study was conducted.
No
Yes
check_circle الجواب — حل مفصل خطوة بخطوة
hourglass_top
🔒
الحل الكامل متاح للمشتركين
اشترك في أرشيف الأسئلة لعرض هذا الحل وآلاف الحلول المفصلة خطوة بخطوة من معلمين معتمدين.