تم الحل ✓
categoryإحصاء
schoolبكالوريوس
event_available2026-07-16
السؤال
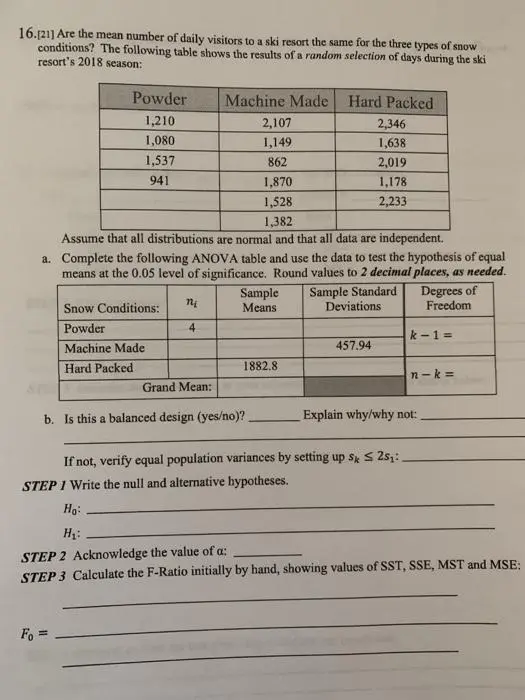
Transcribed Image Text:
16.[21] Are the mean number of daily visitors to a ski resort the same for the three types of snow
conditions? The following table shows the results of a random selection of days during the ski
resort's 2018 season:
Powder
Machine Made
Hard Packed
1,210
2,107
2,346
1,080
1,149
1,638
1,537
862
2,019
941
1,870
1,178
1,528
2,233
1,382
Assume that all distributions are normal and that all data are independent.
a. Complete the following ANOVA table and use the data to test the hypothesis of equal
means at the 0.05 level of significance. Round values to 2 decimal places, as needed.
Sample Standard
Deviations
Degrees of
Freedom
Snow Conditions:
ni
Sample
Means
Powder
4
k-1=
Machine Made
457.94
Hard Packed
1882.8
n-k=
Grand Mean:
Explain why/why not:
b. Is this a balanced design (yes/no)?
If not, verify equal population variances by setting up Sk ≤ 2s₁:
STEP 1 Write the null and alternative hypotheses.
Ho:
H₁:
STEP 2 Acknowledge the value of a:
STEP 3 Calculate the F-Ratio initially by hand, showing values of SST, SSE, MST and MSE:
Fo=
STEP 3 (cont) Using the Distr menu in your calculator, find the associated p-value for F-1, n-k
STEP 4 Set up comparison and state to reject or not...
I verified my results using a
Fo=
test in the calculator.
p-value
Factor
Error
df=
SS=
MS=
df=
SS
=
MS->
STEP 5 State conclusion:
STEP 5 Generate stacked box plots in your calculator and do your best to sketch below:
Make a comment on how the box plots above confirm our conclusion:
check_circle الجواب — حل مفصل خطوة بخطوة
hourglass_top
🔒
الحل الكامل متاح للمشتركين
اشترك في أرشيف الأسئلة لعرض هذا الحل وآلاف الحلول المفصلة خطوة بخطوة من معلمين معتمدين.