تم الحل ✓
categoryإحصاء
schoolبكالوريوس
event_available2026-07-16
السؤال
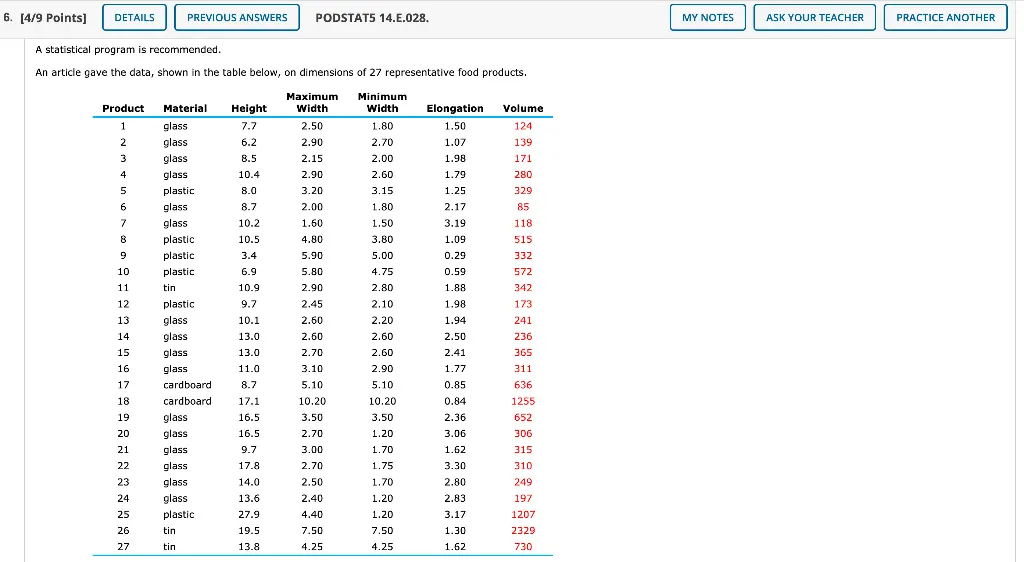
Transcribed Image Text:
6. [4/9 Points]
DETAILS
PREVIOUS ANSWERS
PODSTAT5 14.E.028.
A statistical program is recommended.
An article gave the data, shown in the table below, on dimensions of 27 representative food products.
Maximum
Product
Material
Height
Width
Minimum
Width
Elongation Volume
1
glass
7.7
2.50
1.80
1.50
124
2
glass
6.2
2.90
2.70
1.07
139
3
glass
8.5
2.15
2.00
1.98
171
4
glass
10.4
2.90
2.60
1.79
280
5
plastic
8.0
3.20
3.15
1.25
329
6
glass
8.7
2.00
1.80
2.17
85
7
glass
10.2
1.60
1.50
3.19
118
8
plastic
10.5
4.80
3.80
1.09
515
9
plastic
3.4
5.90
5.00
0.29
332
10
plastic
6.9
5.80
4.75
0.59
572
11
tin
10.9
2.90
2.80
1.88
342
12
plastic
9.7
2.45
2.10
1.98
173
13
glass
10.1
2.60
2.20
1.94
241
14
glass
13.0
2.60
2.60
2.50
236
15
glass
13.0
2.70
2.60
2.41
365
16
glass
11.0
3.10
2.90
1.77
311
17
cardboard
8.7
5.10
5.10
0.85
636
18
cardboard
17.1
10.20
10.20
0.84
1255
19
glass
16.5
3.50
3.50
2.36
652
20
glass
16.5
2.70
1.20
3.06
306
21
glass
9.7
3.00
1.70
1.62
315
22
glass
17.8
2.70
1.75
3.30
310
23
glass
14.0
2.50
1.70
2.80
249
24
glass
13.6
2.40
1.20
2.83
197
25
plastic
27.9
4.40
1.20
3.17
1207
26
tin
19.5
7.50
7.50
1.30
2329
27
tin
13.8
4.25
4.25
1.62
730
MY NOTES
ASK YOUR TEACHER
PRACTICE ANOTHER
(a) Fit a multiple regression model for predicting the volume (in ml) of a package based on its minimum width, maximum width, and elongation score. (Round your answers to two decimal places.
Use x₁ for minimum width, x2 for the maximum width and x3 for the elongation score.)
ŷ =
x1+
x3
(b) Why should we consider adjusted r² instead of 2 when attempting to determine the quality of fit of the data to our model?
We should consider the adjusted 2 instead of 2 because it takes into account the number of predictors used in the model. In this case the adjusted 2 is noticeably less than r².
We should consider the adjusted 2 instead of 2 because it takes into account the number of predictors used in the model. In this case the adjusted² is noticeably greater than r².
We should consider the adjusted 2 instead of 2 because it does not take into account the number of predictors used in the model. In this case the adjusted r² is noticeably greater
than 2.
We should consider the adjusted 2 instead of 2 because it does not take into account the number of predictors used in the model. In this case the adjusted r² is noticeably less than
2.
(c) Perform a model utility test at a 0.05 significance level.
State the null and alternative hypotheses.
=
=
=
Ho B1 B2 B3 0
H: B₁, B and B are all not 0
=
Ho B1 B2 B3 = 0
H₂: at least one of ẞ₁, B₂ or B3 is not 0
1'
Ho: at least one of ẞ₁, B₂ or ẞ is not 0
=
=
Ha B1 B2 B3 = 0
1'
Ho: B1, B2 and B3 are all not 0
=
Ha B1 B2 B3 0
Calculate the test statistic. (Round your answer to two decimal places.)
F =
What can be said about the P-value for this test?
P-value 0.100
0.050 P-value < 0.100
0.010 P-value < 0.050
0.001 P-value < 0.010
P-value <0.001
What can you conclude?
Reject Ho. We have convincing evidence that the multiple regression model is useful and can conclude that at least one of B1, B2 or ẞ3 is not 0.
Fail to reject Ho. We do not have convincing evidence that the multiple regression model is useful and cannot conclude that at least one of B1, B2 or ẞ3 is not
0.
Reject Ho. We have convincing evidence that the multiple regression model is useful and can conclude that B₁, ẞ2 and ẞ3 are all not 0.
Fail to reject Ho. We do not have convincing evidence that the multiple regression model is useful and cannot conclude that B1, B2 and ẞ3 are all not 0.
You may need to use the appropriate table in Appendix A to answer this question.
check_circle الجواب — حل مفصل خطوة بخطوة
hourglass_top
🔒
الحل الكامل متاح للمشتركين
اشترك في أرشيف الأسئلة لعرض هذا الحل وآلاف الحلول المفصلة خطوة بخطوة من معلمين معتمدين.