تم الحل ✓
categoryإحصاء
schoolبكالوريوس
event_available2026-07-16
السؤال
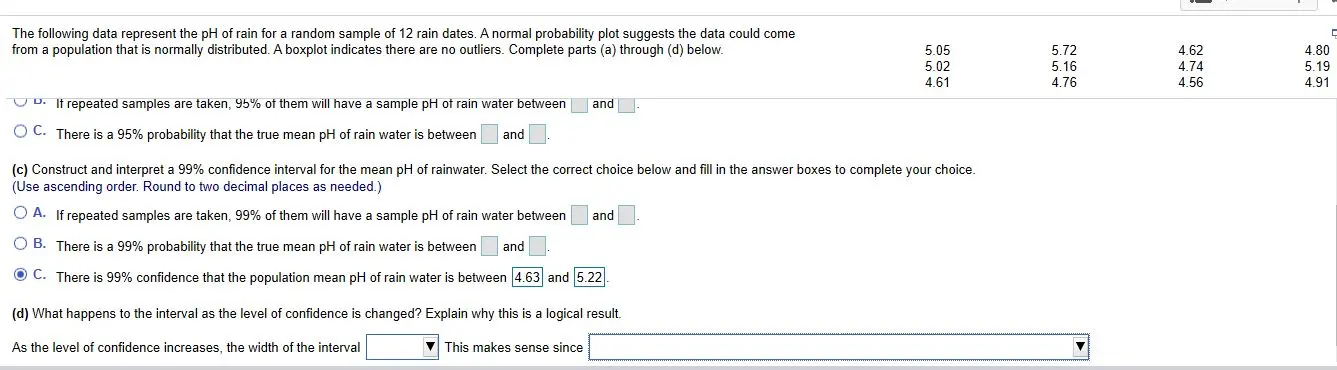
Transcribed Image Text:
The following data represent the pH of rain for a random sample of 12 rain dates. A normal probability plot suggests the data could come
from a population that is normally distributed. A boxplot indicates there are no outliers. Complete parts (a) through (d) below.
5.05
5.72
4.62
4.80
5.02
5.16
4.74
5.19
4.61
4.76
4.56
4.91
D. It repeated samples are taken, 95% of them will have a sample pH of rain water between and
◇ C. There is a 95% probability that the true mean pH of rain water is between
and
(c) Construct and interpret a 99% confidence interval for the mean pH of rainwater. Select the correct choice below and fill in the answer boxes to complete your choice.
(Use ascending order. Round to two decimal places as needed.)
A. If repeated samples are taken, 99% of them will have a sample pH of rain water between and
◇ B. There is a 99% probability that the true mean pH of rain water is between
and
C. There is 99% confidence that the population mean pH of rain water is between 4.63 and 5.22
(d) What happens to the interval as the level of confidence is changed? Explain why this is a logical result.
As the level of confidence increases, the width of the interval
This makes sense since
check_circle الجواب — حل مفصل خطوة بخطوة
hourglass_top
🔒
الحل الكامل متاح للمشتركين
اشترك في أرشيف الأسئلة لعرض هذا الحل وآلاف الحلول المفصلة خطوة بخطوة من معلمين معتمدين.