تم الحل ✓
categoryالهندسة الميكانيكية
schoolبكالوريوس
event_available2026-07-15
السؤال
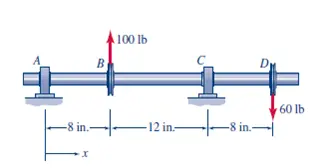
Transcribed Image Text:
B
100 lb
D
60 lb
-8 in.-
-12 in.-
-8 in.-
-x
Equation
dV
= p(x) (Eq. 5.2)
dx
AV Po (Eq. 54)
Load
Diagram
Shear
Diagram
1. Slope of shear diagram equals value of load
Moment
Diagram
M
V₁
Slope P₁
2. Jump in shear equals value of concentrated load
M₁
V₁
Positive V-jump
V₂
M₂
V₂
M₂
3. Change in shear equals area under distributed-load diagram
V₁₂- V₁ =
LP(r)dx
p(x)dx (Eq. 5.6)
dM
dx
=V(x) (Eq.5.3)
(Area)
M
My
V₂-V₁ = (Area)
4. Slope of moment diagram equals value of shear
5. Jump in moment equals (value of concentrated couple)
Mo
6. Change in moment equals area under shear diagram
AM -Mo (Eq. 5.5)
MV
M₂-My-
[*V(x)dx
V(x)dx (Eq.5.7)
Slope - V₁
M
Negative M-jump
M₂
M₂
(Area)y
V₂
M₂-M₁ = (Area)
M₂
Fig. 1
Use Eqs. 5.2 through 5.7 to sketch shear and moment diagrams for the
simply-supported beam shown in Fig. 1.
Plan the Solution We can use a free-body diagram of the beam AC to
determine the reactions at A and C. Since there is no distributed load on
the beam, p(x) = 0 everywhere. Because of the concentrated load at B.
we need to consider two spans, 0 <x<a and a <x<L
Solution
Equilibrium-Reactions: To determine the reactions A, and C,, we first
draw the free-body diagram of the entire beam AC (Fig. 2).
B
Vix) PU-
L
B
L-a
(a) Load diagram.
(3)
(2)
(1)
(4)
-2 F
A
P
(5)
(b) Shear diagram.
M(x)
(3)
(4)
(2)
(1)
(c) Moment diagram.
(6)
+C(ΣM)-
- 0:
+C(ΣM)
- 0:
Ay
Fig. 2 A free-body diagram.
Pa-CyL = 0, Cy = P(+)
A,L-P(La) 0, Ay
P(L-a)
-
L
Shear Diagram: Equations 5.2, 5.4, and 5.6 involve the shear. Using
these equations, we can sketch V(x) progressively from x = 0 to x = L.
It is convenient to sketch the shear and moment diagrams directly below
the load diagram (Fig. 3a). Each step involved in sketching V(x) is
numbered in Fig. 3b.
1. The shear at x = 0 is zero.
2. The shear at x=0 is determined from Eq. 5.4, that is, AVA
Ay
m
(5)
Fig. 3 Shear and moment diagrams.
P(La)
L
=
Note that, because of the sign convention for shear,
an upward concentrated force causes an upward jump in the shear
diagram.
3. For 0<x<a, p(x) = 0. Therefore, from Eq. 5.2, dV/dx = 0.
4. Atx a there is a downward force P, so AVB = -P.
dV
5. For a <x<L, p(x) = 0, so-
= 0.
dx
Pa
6. The reaction at C causes AVC which closes the shear diagram
back to zero at x=L'.
Moment Diagram: Equations 5.3, 5.5, and 5.7 relate to M(x) and can be
used to sketch the moment diagram in Fig. 3c. Steps in the construction
of the moment diagram are explained and numbered.
1. The moment at x=0 is zero [simply supported beam].
dM
dx
2. For 0<x<a, Eq. 5.3 gives = V(x)=-
P(L-a)
L
= constant.
3. Atxa, M(a) can be determined from Eq. 5.7 as the area of the
rectangle under the shear curve from x = 0 to x = a. Therefore
maximum bending moment.
-0-|V(x)dx=
P(L-a),
=
L
(a). M(a)
=
Pa(L-a)
L
is the
dM
-Pa
4. For a<x<L, Eq. 5.3 gives -
V(x)=
= constant.
dx
5. Equation 5.7 gives M(L) M(a) =
- [V(x)d
Pa
V(x)dx
(L-a),
which closes the moment diagram back to zero at x = L, as it should
[simple support at C].
Review the Solution The dimensions on the shear diagram (F) and the
moment diagram (FL) are correct. If we draw finite free-body diagrams
of the ends of the beam, we get Fig. 4. Therefore, the shear diagram in Fig.
36 has the correct signs according to the free-body sketches in Fig. 4 and the
sign convention in Fig. 5.6. The downward force will bend the beam as
shown in Fig. 5, which is consistent with the fact that the bending moment
is positive everywhere. The maximum bending moment occurs at the cross
section where the force P is applied and where the shear force changes sign.
B
Shear
Fig. 4
Fig. 5
Shear
Use Eqs. 5.2 through 5.7 to sketch shear and moment diagrams for
simply supported beam shown in Fig. 1.
Plan the Solution We can use a free-body diagram of the beam AC in
Fig. 2 to determine the reactions at A and C. Since there is no distributed
load on the beam, p(x) = 0 everywhere. Because of the concentrated
couple at B, we need to consider two spans, 0 < x <a and a <x<L
Solution
Equilibrium-Reactions: We first determine the reactions A, and Cy.
-Mo
L
(1)
V(x)
A₂
Ma
Fig. 1
B
Fig. 2 A free-body diagram.
(2)
M(x)
(D)
(2)
(a) Load diagram.
(b) Shear diagram.
(3)
-My-)
L
(c) Moment diagram.
Мо
+C(μM)-
+C (ΣM)-
= 0:
-Mo - C,L=0→C, =
Mo
-0→A,
- 0:
A,L-Mo-
Shear Diagram: Equations 5.2, 5.4, and 5.6 involve the shear. Using
these equations and the load diagram in Fig. 3a, we can sketch V(x) pro-
gressively from x = 0 to x = L. It is convenient to sketch the shear and
moment diagrams directly below the load diagram. Each step involved in
sketching V(x) is numbered in Fig. 3b.
1. The shear at x=0" is zero.
2. The shear at x = 0 is determined from Eq. 5.4, that is, AV₁ =
A, M/L. Note that, because of the sign convention for shear,
an upward concentrated force causes an upward jump in the shear
diagram.
3. For 0<x<L.p(x) = 0. Therefore, from Eq. 5.2, dV/dx = 0, V(x)=
M/L = constant.
4. The reaction at C causes AVC --M/L, which closes the shear
diagram back to zero at x = L".
Moment Diagram: Equations 5.3, 5.5, and 5.7 relate to M(x) and can be
(4) used to sketch the moment diagram in Fig. 3c. Steps in the construction
of the moment diagram are explained and numbered.
1. The moment at x = 0 is zero (simply supported beam).
2. For <x<a, Eq. 5.3 gives dM/dx = V(x) = M/L = constant.
3. Atxa, M(a) can be determined from Eq. 5.7 as the area of the
rectangle under the shear curve from x = 0 to x = a. Therefore
M(a) -0- fgv(x)dx = M₁al L.
4. At xa there is a negative jump in moment given by Eq. 5.5. So
Moa
MoL-a)
L
L
M(a)=-
5.
Fig. 3 Load, shear, and moment
diagrams
6.
Mo=
For a<x<L, Eq. 5.3 gives dM/dx = V(x) = M/L = constant.
Equation 5.7 gives M(L) M(a) = V(x)dx = (M/L)(La),
which closes the moment diagram back to zero at x = L, as it should
[simple support at C].
Review the Solution The dimensions on the shear diagram (F) and the
moment diagram (F. L) are correct. Note that both the maximum
moment, Moall, and the minimum bending moment, -Mo(La)/L,
occur at the cross section where the concentrated couple acts. Compare
this example with the previous one, where there was a concentrated.
force.
Determine the reactions and sketch the shear and moment diagrams for
the beam shown in Fig. 1. (This beam is said to have an overhang BC.)
Show all significant values (that is, maxima, minima, positions of maxima
and minima, etc.) on the diagrams.
8 kN/m
16kN
Fig. 1
Plan the Solution We can use a free-body diagram of the whole beam
to compute the reactions. Then we can use Eqs. 5.2 through 5.7 to sketch
the V(x) and M(x) diagrams, as we did in Examples 5.7 and 5.8.
Solution
Equilibrium-Reactions: The reactions must be determined first. Figure 2
shows the appropriate free-body diagram.
18(4) 32 kN
-2m-l
16 KN
4m
2 m
Ay
By
Fig. 2 A free-body diagram.
+ C(ΣM)₁ = 0
0:
(8 kN/m)(4 m)(2 m) + (16 kN)(6 m) By(4 m) = 0
By=
=40 kN
+ C(ΣM)=
0:
-
A,(4 m) (8 kN/m)(4 m)(2 m) + (16 kN)(2m) = 0
A,
= 8 kN
Check: Is Fy=0?
8 3240 160? Yes
Ans.
Ans.
8 kN
V(KN)
(2)
(1)
(8)
8 kN/m
40 kN
(a) Load diagram
16kN
(6)
(5)
16
(7)
x(m)
It is convenient to sketch the V (Fig. 3b) and M (Fig. 3c) diagrams
directly below a sketch of the beam that has all of the loads and reactions
shown (Fig. 3a).
Shear Diagram: The following steps are used in sketching the shear
diagram (Fig. 3b).
1. V(0)=0 [no shear at end of beam].
2. V(0) 8 kN [Eq. 5.4].
3. dV/dx--8 kN/m [Eq. 5.2].
4. V(4) V(0) + (-8 kN/m)(4 m) -8-32-24 kN [Eq.5.6].
5. V(4) V(4) = 40 kN [Eq. 5.4].
6. dV/dx 0 [Eq. 5.2].
=
(3)
24H
7.
V(6) V(6)-16=0.
(b) Shear diagram.
8.
4
(1)
kNm)
-32H
(2
(3) & (4)
Im
(6)
(e) Moment diagram.
116
(8)
x(m)
Fig. 3 Shear and moment diagrams.
16kN
Shear
8 EN
Shear
ப
8 kN
རྒྱལ
(a)
Shear
16kN
AB
C
B
24 KN
40 kN
(b)
Fig. 4
Since dV/dx=-8 for 0 <x<4 m, and since V(0) = 8 kN, V = 0
at x = 1 m [Eq. 5.6].
Moment Diagram: The steps employed in constructing the moment dia-
gram (Fig. 3c) using Eqs. 5.2 through 5.7 will now be described:
1. M(0) = 0 [no moment at end of beam].
2. From dM/dx = V(x) we have the slope of M(x) going from +8
kN m/m at x=0 to zero at x = x=1 m. Therefore, the mo-
ment diagram for 0 < x <1 m must have the general shape.
[Eq.5.3].
3. M(x) is maximum where V(x) = 0 [Eq. 5.3].
4.
M(1) M(0)+5V(x)dx = (8 kN)(1 m) = 4 kN·m [Eq. 5.7; area
of triangle].
5. From x = 1 m to x 4 m, V(x) gets progressively more negative.
Therefore, M(x) must have the general shape [Eq.5.3].
6. M(4) M(0)+ V(x)dx=0+ (8 kN)(1 m)+(-24 kN)(3 m) =
-32 kN m (Eq. 5.7; net of areas of triangles]
7. dM/dx V(x)-16 kN [Eq.5.3].
8. M(6) M(4)+5V(x)dx = -32 kNm+ (16 kN)(2 m) = 0 [Eq.
5.7; no moment at end of beam].
The maximum shear occurs just to the left of the support at B and
has a magnitude of 24 kN. The maximum positive moment occurs where
V = 0 at x = 1 m and has a magnitude of 4 kN m; and the maximum
16kN negative moment occurs at the support B, and it has a magnitude of
32 kN·m.
(c)
Review the Solution By imagining cuts just to the right of A (Fig. 4a),
just to the left of B (Fig. 4b), and just to the right of B (Fig. 4c), we can
check the sign of the shear at these points.
The moment diagram is best checked by seeing if the sign of the
moment diagram corresponds to a reasonable deflected shape, that is,
concave upward where M(x) is positive and concave downward where
Deflection.
M positive
exaggerated
M negative
Fig. 5 A sketch showing the deflection of beam AC.
M(x) is negative, according to the sign convention that is given Fig. 5.6c.
Where M(x) = 0, the beam is locally straight, that is, it is neither concave
upward nor concave downward. We are able to sketch (Fig. 5) a plausi-
ble deflection curve that passes over the supports at A and B and that is
concave upward where M(x) is positive and concave downward where M
is negative. The distributed load between A and B and the concentrated
load at C could, indeed, cause the beam to deflect as sketched.
Mo
Fig. 1
B
Fig. 2 A free-body diagram.
(a) Load diagram.
Vix)
L
(2)
(1)
MIX)
(b) Shear diagram.
(1)
(2)
(3)
L
L
(c) Moment diagram.
load on the beam, p(x) = 0 everywhere. Because of the concentrated
couple at B, we need to consider two spans, 0<x<a and a<x<L.
Solution
Equilibrium-Reactions: We first determine the reactions A, and Cy.
- 0:
+C (ΣM)-
+C (ΣM)=
0:
-Mo
-Mo-CL-0→Cy
-
A,L. - Mo=0→A, M
Shear Diagram: Equations 5.2, 5.4, and 5.6 involve the shear. Using
these equations and the load diagram in Fig. 3a, we can sketch V(x) pro-
gressively from x = 0 to x-L. It is convenient to sketch the shear and
moment diagrams directly below the load diagram. Each step involved in
sketching V(x) is numbered in Fig. 3b.
1. The shear at x=0" is zero.
2. The shear at x=0 is determined from Eq. 5.4, that is, AV₁ =
A, M/L. Note that, because of the sign convention for shear,
an upward concentrated force causes an upward jump in the shear
diagram.
3. For 0<x<Lp(x) = 0. Therefore, from Eq. 5.2, dVidx = 0, V(x) =
ML constant.
4. The reaction at C causes AV-M/L, which closes the shear
diagram back to zero at x = L*.
Moment Diagram: Equations 5.3, 5.5, and 5.7 relate to M(x) and can be
(4) used to sketch the moment diagram in Fig. 3c. Steps in the construction.
of the moment diagram are explained and numbered.
(6)
1. The moment at x = 0 is zero (simply supported beam).
2. For 0<x<a, Eq. 5.3 gives dM/dx = V(x) = M/L = constant.
3. Atxa,M(a) can be determined from Eq. 5.7 as the area of the
rectangle under the shear curve from x = 0 to x = a." Therefore
M(a)-0fgV(x)dx = Moal L.
4. At x = a there is a negative jump in moment given by Eq.5.5. So
Moa
Mo(L-a)
L
L
M(a)=
5.
Fig. 3 Load, shear, and moment
diagrams.
6.
-
Mo=
For a <x<L, Eq. 5.3 gives dM/dx - V(x) - M/L - constant.
Equation 5.7 gives M(L) M(a) = f(x)dx = (M/L)(La),
which closes the moment diagram back to zero at x = L, as it should
[simple support at C].
Review the Solution The dimensions on the shear diagram (F) and the
moment diagram (F L) are correct. Note that both the maximum
moment, Moall, and the minimum bending moment, -Mo(La)/L,
occur at the cross section where the concentrated couple acts. Compare
this example with the previous one, where there was a concentrated
force.
dV
= p(x)
dx
dM
== V(x)
dx
AVA = Po
|AMB = MB
V2 V₁ =
x2
x1
p(x)dx
M₂-M₁ =
V(x) dx
M(x)
M(x)
DC1
V(x)
V(x)
(a) Positive V and M on section "x."
+x face
+y face
M
M V
V
V
(b) Positive shear.
(c) Positive moment.
(d) Positive V and M.
A
2P
B
C
D
x
3a
|_ 2a | 2a |
За
E
2P
3 Pa
Equation
dV
= p(x) (Eq. 5.2)
dx
AV Po (Eq. 54)
Load
Diagram
Shear
Diagram
1. Slope of shear diagram equals value of load
Moment
Diagram
M
V₁
Slope P₁
2. Jump in shear equals value of concentrated load
M₁
V₁
Positive V-jump
V₂
M₂
V₂
M₂
3. Change in shear equals area under distributed-load diagram
V₁₂- V₁ =
LP(r)dx
p(x)dx (Eq. 5.6)
dM
dx
=V(x) (Eq.5.3)
(Area)
M
My
V₂-V₁ = (Area)
4. Slope of moment diagram equals value of shear
5. Jump in moment equals (value of concentrated couple)
Mo
6. Change in moment equals area under shear diagram
AM -Mo (Eq. 5.5)
MV
M₂-My-
[*V(x)dx
V(x)dx (Eq.5.7)
Slope - V₁
M
Negative M-jump
M₂
M₂
(Area)y
V₂
M₂-M₁ = (Area)
M₂
Fig. 1
Use Eqs. 5.2 through 5.7 to sketch shear and moment diagrams for the
simply-supported beam shown in Fig. 1.
Plan the Solution We can use a free-body diagram of the beam AC to
determine the reactions at A and C. Since there is no distributed load on
the beam, p(x) = 0 everywhere. Because of the concentrated load at B.
we need to consider two spans, 0 <x<a and a <x<L
Solution
Equilibrium-Reactions: To determine the reactions A, and C,, we first
draw the free-body diagram of the entire beam AC (Fig. 2).
B
Vix) PU-
B
L-a
(a) Load diagram.
L
(3)
(2)
(1)
(4)
-2 F
P
(5)
(b) Shear diagram.
M(x)
(3)
(4)
(2)
(1)
(c) Moment diagram.
(6)
+C(ΣM)-
- 0:
+C(ΣM)
- 0:
Ay
Fig. 2 A free-body diagram.
Pa-CyL = 0, Cy = P(+)
A,L-P(La) 0, Ay
P(L-a)
-
L
Shear Diagram: Equations 5.2, 5.4, and 5.6 involve the shear. Using
these equations, we can sketch V(x) progressively from x = 0 to x = L.
It is convenient to sketch the shear and moment diagrams directly below
the load diagram (Fig. 3a). Each step involved in sketching V(x) is
numbered in Fig. 3b.
1. The shear at x = 0 is zero.
2. The shear at x=0 is determined from Eq. 5.4, that is, AVA
Ay
m
(5)
Fig. 3 Shear and moment diagrams.
P(La)
L
=
Note that, because of the sign convention for shear,
an upward concentrated force causes an upward jump in the shear
diagram.
3. For 0<x<a, p(x) = 0. Therefore, from Eq. 5.2, dV/dx = 0.
4. Atx a there is a downward force P, so AVB = -P.
dV
5. For a<x<L, p(x) = 0, so-
= 0.
dx
Pa
6. The reaction at C causes AVC which closes the shear diagram
back to zero at x=L'.
Moment Diagram: Equations 5.3, 5.5, and 5.7 relate to M(x) and can be
used to sketch the moment diagram in Fig. 3c. Steps in the construction
of the moment diagram are explained and numbered.
1. The moment at x=0 is zero [simply supported beam].
dM
dx
2. For 0<x<a, Eq. 5.3 gives = V(x)=-
P(L-a)
L
= constant.
3. Atxa, M(a) can be determined from Eq. 5.7 as the area of the
rectangle under the shear curve from x = 0 to x = a. Therefore
maximum bending moment.
-0-|V(x)dx=
P(L-a),
=
L
(a). M(a)
=
Pa(L-a)
L
is the
dM
-Pa
4. For a<x<L, Eq. 5.3 gives -
dx
V(x)=
= constant.
5. Equation 5.7 gives M(L) M(a) =
- [V(x)d
Pa
V(x)dx
(L-a),
which closes the moment diagram back to zero at x = L, as it should
[simple support at C].
Review the Solution The dimensions on the shear diagram (F) and the
moment diagram (FL) are correct. If we draw finite free-body diagrams
of the ends of the beam, we get Fig. 4. Therefore, the shear diagram in Fig.
36 has the correct signs according to the free-body sketches in Fig. 4 and the
sign convention in Fig. 5.6. The downward force will bend the beam as
shown in Fig. 5, which is consistent with the fact that the bending moment
is positive everywhere. The maximum bending moment occurs at the cross
section where the force P is applied and where the shear force changes sign.
B
Shear
Fig. 4
Fig. 5
Shear
Use Eqs. 5.2 through 5.7 to sketch shear and moment diagrams for
simply supported beam shown in Fig. 1.
Plan the Solution We can use a free-body diagram of the beam AC in
Fig. 2 to determine the reactions at A and C. Since there is no distributed
load on the beam, p(x) = 0 everywhere. Because of the concentrated
couple at B, we need to consider two spans, 0 < x <a and a <x<L
Solution
Equilibrium-Reactions: We first determine the reactions A, and Cy.
-Mo
L
(1)
V(x)
A₂
Ma
Fig. 1
B
Fig. 2 A free-body diagram.
(2)
M(x)
(D)
(2)
(a) Load diagram.
(b) Shear diagram.
(3)
-My-)
L
(c) Moment diagram.
Мо
+C(μM)-
+C (ΣM)-
= 0:
-Mo - C,L=0→C, =
Mo
-0→A,
- 0:
A,L-Mo-
Shear Diagram: Equations 5.2, 5.4, and 5.6 involve the shear. Using
these equations and the load diagram in Fig. 3a, we can sketch V(x) pro-
gressively from x = 0 to x = L. It is convenient to sketch the shear and
moment diagrams directly below the load diagram. Each step involved in
sketching V(x) is numbered in Fig. 3b.
1. The shear at x=0" is zero.
2. The shear at x = 0 is determined from Eq. 5.4, that is, AV₁ =
A, M/L. Note that, because of the sign convention for shear,
an upward concentrated force causes an upward jump in the shear
diagram.
3. For 0<x<L.p(x) = 0. Therefore, from Eq. 5.2, dV/dx = 0, V(x)=
M/L = constant.
4. The reaction at C causes AVC --M/L, which closes the shear
diagram back to zero at x = L".
Moment Diagram: Equations 5.3, 5.5, and 5.7 relate to M(x) and can be
(4) used to sketch the moment diagram in Fig. 3c. Steps in the construction
of the moment diagram are explained and numbered.
1. The moment at x = 0 is zero (simply supported beam).
2. For <x<a, Eq. 5.3 gives dM/dx = V(x) = M/L = constant.
3. Atxa, M(a) can be determined from Eq. 5.7 as the area of the
rectangle under the shear curve from x = 0 to x = a. Therefore
M(a) -0- fgv(x)dx = M₁al L.
4. At xa there is a negative jump in moment given by Eq. 5.5. So
Moa
MoL-a)
L
L
M(a)=-
5.
Fig. 3 Load, shear, and moment
diagrams
6.
Mo=
For a<x<L, Eq. 5.3 gives dM/dx = V(x) = M/L = constant.
Equation 5.7 gives M(L) M(a) = V(x)dx = (M/L)(La),
which closes the moment diagram back to zero at x = L, as it should
[simple support at C].
Review the Solution The dimensions on the shear diagram (F) and the
moment diagram (F. L) are correct. Note that both the maximum
moment, Moall, and the minimum bending moment, -Mo(La)/L,
occur at the cross section where the concentrated couple acts. Compare
this example with the previous one, where there was a concentrated.
force.
Determine the reactions and sketch the shear and moment diagrams for
the beam shown in Fig. 1. (This beam is said to have an overhang BC.)
Show all significant values (that is, maxima, minima, positions of maxima
and minima, etc.) on the diagrams.
8 kN/m
16kN
Fig. 1
Plan the Solution We can use a free-body diagram of the whole beam
to compute the reactions. Then we can use Eqs. 5.2 through 5.7 to sketch
the V(x) and M(x) diagrams, as we did in Examples 5.7 and 5.8.
Solution
Equilibrium-Reactions: The reactions must be determined first. Figure 2
shows the appropriate free-body diagram.
18(4) 32 kN
-2m-l
16 KN
4m
2 m
Ay
By
Fig. 2 A free-body diagram.
+ C(ΣM)₁ = 0
0:
(8 kN/m)(4 m)(2 m) + (16 kN)(6 m) By(4 m) = 0
By=
=40 kN
+ C(ΣM)=
0:
-
A,(4 m) (8 kN/m)(4 m)(2 m) + (16 kN)(2m) = 0
A,
= 8 kN
Check: Is Fy=0?
8 3240 160? Yes
Ans.
Ans.
8 kN
V(KN)
(2)
(1)
(8)
8 kN/m
40 kN
(a) Load diagram
16kN
(6)
(5)
16
(7)
x(m)
It is convenient to sketch the V (Fig. 3b) and M (Fig. 3c) diagrams
directly below a sketch of the beam that has all of the loads and reactions
shown (Fig. 3a).
Shear Diagram: The following steps are used in sketching the shear
diagram (Fig. 3b).
1. V(0)=0 [no shear at end of beam].
2. V(0) 8 kN [Eq. 5.4].
3. dV/dx--8 kN/m [Eq. 5.2].
4. V(4) V(0) + (-8 kN/m)(4 m) -8-32-24 kN [Eq.5.6].
5. V(4) V(4) = 40 kN [Eq. 5.4].
6. dV/dx 0 [Eq. 5.2].
=
(3)
24H
7.
V(6) V(6)-16=0.
(b) Shear diagram.
8.
4
(1)
kNm)
-32H
(2
(3) & (4)
Im
(6)
(e) Moment diagram.
116
(8)
x(m)
Fig. 3 Shear and moment diagrams.
16kN
Shear
8 EN
Shear
ப
8 kN
རྒྱལ
(a)
Shear
16kN
AB
C
B
24 KN
40 kN
(b)
Fig. 4
Since dV/dx=-8 for 0 <x<4 m, and since V(0) = 8 kN, V = 0
at x = 1 m [Eq. 5.6].
Moment Diagram: The steps employed in constructing the moment dia-
gram (Fig. 3c) using Eqs. 5.2 through 5.7 will now be described:
1. M(0) = 0 [no moment at end of beam].
2. From dM/dx = V(x) we have the slope of M(x) going from +8
kN m/m at x=0 to zero at x = x=1 m. Therefore, the mo-
ment diagram for 0 < x <1 m must have the general shape.
[Eq.5.3].
3. M(x) is maximum where V(x) = 0 [Eq. 5.3].
4.
M(1) M(0)+5V(x)dx = (8 kN)(1 m) = 4 kN·m [Eq. 5.7; area
of triangle].
5. From x = 1 m to x 4 m, V(x) gets progressively more negative.
Therefore, M(x) must have the general shape [Eq.5.3].
6. M(4) M(0)+ V(x)dx=0+ (8 kN)(1 m)+(-24 kN)(3 m) =
-32 kN m (Eq. 5.7; net of areas of triangles]
7. dM/dx V(x)-16 kN [Eq.5.3].
8. M(6) M(4)+5V(x)dx = -32 kNm+ (16 kN)(2 m) = 0 [Eq.
5.7; no moment at end of beam].
The maximum shear occurs just to the left of the support at B and
has a magnitude of 24 kN. The maximum positive moment occurs where
V = 0 at x = 1 m and has a magnitude of 4 kN m; and the maximum
16kN negative moment occurs at the support B, and it has a magnitude of
32 kN·m.
(c)
Review the Solution By imagining cuts just to the right of A (Fig. 4a),
just to the left of B (Fig. 4b), and just to the right of B (Fig. 4c), we can
check the sign of the shear at these points.
The moment diagram is best checked by seeing if the sign of the
moment diagram corresponds to a reasonable deflected shape, that is,
concave upward where M(x) is positive and concave downward where
Deflection.
M positive
exaggerated
M negative
Fig. 5 A sketch showing the deflection of beam AC.
M(x) is negative, according to the sign convention that is given Fig. 5.6c.
Where M(x) = 0, the beam is locally straight, that is, it is neither concave
upward nor concave downward. We are able to sketch (Fig. 5) a plausi-
ble deflection curve that passes over the supports at A and B and that is
concave upward where M(x) is positive and concave downward where M
is negative. The distributed load between A and B and the concentrated
load at C could, indeed, cause the beam to deflect as sketched.
Mo
Fig. 1
B
Fig. 2 A free-body diagram.
(a) Load diagram.
Vix)
L
(2)
(1)
MIX)
(b) Shear diagram.
(1)
(2)
(3)
L
L
(c) Moment diagram.
load on the beam, p(x) = 0 everywhere. Because of the concentrated
couple at B, we need to consider two spans, 0<x<a and a<x<L.
Solution
Equilibrium-Reactions: We first determine the reactions A, and Cy.
- 0:
+C (ΣM)-
+C (ΣM)=
0:
-Mo
-Mo-CL-0→Cy
-
A,L. - Mo=0→A, M
Shear Diagram: Equations 5.2, 5.4, and 5.6 involve the shear. Using
these equations and the load diagram in Fig. 3a, we can sketch V(x) pro-
gressively from x = 0 to x-L. It is convenient to sketch the shear and
moment diagrams directly below the load diagram. Each step involved in
sketching V(x) is numbered in Fig. 3b.
1. The shear at x=0" is zero.
2. The shear at x=0 is determined from Eq. 5.4, that is, AV₁ =
A, M/L. Note that, because of the sign convention for shear,
an upward concentrated force causes an upward jump in the shear
diagram.
3. For 0<x<Lp(x) = 0. Therefore, from Eq. 5.2, dVidx = 0, V(x) =
ML constant.
4. The reaction at C causes AV-M/L, which closes the shear
diagram back to zero at x = L*.
Moment Diagram: Equations 5.3, 5.5, and 5.7 relate to M(x) and can be
(4) used to sketch the moment diagram in Fig. 3c. Steps in the construction.
of the moment diagram are explained and numbered.
(6)
1. The moment at x = 0 is zero (simply supported beam).
2. For 0<x<a, Eq. 5.3 gives dM/dx = V(x) = M/L = constant.
3. Atxa,M(a) can be determined from Eq. 5.7 as the area of the
rectangle under the shear curve from x = 0 to x = a." Therefore
M(a)-0fgV(x)dx = Moal L.
4. At x = a there is a negative jump in moment given by Eq.5.5. So
Moa
Mo(L-a)
L
L
M(a)=
5.
Fig. 3 Load, shear, and moment
diagrams.
6.
-
Mo=
For a <x<L, Eq. 5.3 gives dM/dx - V(x) - M/L - constant.
Equation 5.7 gives M(L) M(a) = f(x)dx = (M/L)(La),
which closes the moment diagram back to zero at x = L, as it should
[simple support at C].
Review the Solution The dimensions on the shear diagram (F) and the
moment diagram (F L) are correct. Note that both the maximum
moment, Moall, and the minimum bending moment, -Mo(La)/L,
occur at the cross section where the concentrated couple acts. Compare
this example with the previous one, where there was a concentrated
force.
dV
= p(x)
dx
dM
== V(x)
dx
AVA = Po
|AMB = MB
V2 V₁ =
x2
x1
p(x)dx
M₂-M₁ =
V(x) dx
M(x)
M(x)
DC1
V(x)
V(x)
(a) Positive V and M on section "x."
+x face
+y face
M
M V
V
V
(b) Positive shear.
(c) Positive moment.
(d) Positive V and M.
A
1 kip
2 kips
B
E
C
2-
2 ft 2 ft 2 ft 2 ft
D
Equation
dV
= p(x) (Eq. 5.2)
dx
AV Po (Eq. 54)
Load
Diagram
Shear
Diagram
1. Slope of shear diagram equals value of load
Moment
Diagram
M
V₁
Slope P₁
2. Jump in shear equals value of concentrated load
M₁
V₁
Positive V-jump
V₂
M₂
V₂
M₂
3. Change in shear equals area under distributed-load diagram
V₁₂- V₁ =
LP(r)dx
p(x)dx (Eq. 5.6)
dM
dx
=V(x) (Eq.5.3)
(Area)
M
My
V₂-V₁ = (Area)
4. Slope of moment diagram equals value of shear
5. Jump in moment equals (value of concentrated couple)
Mo
6. Change in moment equals area under shear diagram
AM -Mo (Eq. 5.5)
MV
M₂-My-
[*V(x)dx
V(x)dx (Eq.5.7)
Slope - V₁
M
Negative M-jump
M₂
M₂
(Area)y
V₂
M₂-M₁ = (Area)
M₂
Fig. 1
Use Eqs. 5.2 through 5.7 to sketch shear and moment diagrams for the
simply-supported beam shown in Fig. 1.
Plan the Solution We can use a free-body diagram of the beam AC to
determine the reactions at A and C. Since there is no distributed load on
the beam, p(x) = 0 everywhere. Because of the concentrated load at B.
we need to consider two spans, 0 <x<a and a <x<L
Solution
Equilibrium-Reactions: To determine the reactions A, and C,, we first
draw the free-body diagram of the entire beam AC (Fig. 2).
B
Vix) PU-
B
L-a
(a) Load diagram.
L
(3)
(2)
(1)
(4)
-2 F
P
(5)
(b) Shear diagram.
M(x)
(3)
(4)
(2)
(1)
(c) Moment diagram.
(6)
+C(ΣM)-
- 0:
+C(ΣM)
- 0:
Ay
Fig. 2 A free-body diagram.
Pa-CyL = 0, Cy = P(+)
A,L-P(La) 0, Ay
P(L-a)
-
L
Shear Diagram: Equations 5.2, 5.4, and 5.6 involve the shear. Using
these equations, we can sketch V(x) progressively from x = 0 to x = L.
It is convenient to sketch the shear and moment diagrams directly below
the load diagram (Fig. 3a). Each step involved in sketching V(x) is
numbered in Fig. 3b.
1. The shear at x = 0 is zero.
2. The shear at x=0 is determined from Eq. 5.4, that is, AVA
Ay
m
(5)
Fig. 3 Shear and moment diagrams.
P(La)
L
=
Note that, because of the sign convention for shear,
an upward concentrated force causes an upward jump in the shear
diagram.
3. For 0<x<a, p(x) = 0. Therefore, from Eq. 5.2, dV/dx = 0.
4. Atx a there is a downward force P, so AVB = -P.
dV
5. For a <x<L, p(x) = 0, so-
= 0.
dx
Pa
6. The reaction at C causes AVC which closes the shear diagram
back to zero at x=L'.
Moment Diagram: Equations 5.3, 5.5, and 5.7 relate to M(x) and can be
used to sketch the moment diagram in Fig. 3c. Steps in the construction
of the moment diagram are explained and numbered.
1. The moment at x=0 is zero [simply supported beam].
dM
dx
2. For 0<x<a, Eq. 5.3 gives = V(x)=-
P(L-a)
L
= constant.
3. Atxa, M(a) can be determined from Eq. 5.7 as the area of the
rectangle under the shear curve from x = 0 to x = a. Therefore
maximum bending moment.
-0-|V(x)dx=
P(L-a),
=
L
(a). M(a)
=
Pa(L-a)
L
is the
dM
-Pa
4. For a<x<L, Eq. 5.3 gives -
V(x)=
= constant.
dx
5. Equation 5.7 gives M(L) M(a) =
- [V(x)d
Pa
V(x)dx
(L-a),
which closes the moment diagram back to zero at x = L, as it should
[simple support at C].
Review the Solution The dimensions on the shear diagram (F) and the
moment diagram (FL) are correct. If we draw finite free-body diagrams
of the ends of the beam, we get Fig. 4. Therefore, the shear diagram in Fig.
36 has the correct signs according to the free-body sketches in Fig. 4 and the
sign convention in Fig. 5.6. The downward force will bend the beam as
shown in Fig. 5, which is consistent with the fact that the bending moment
is positive everywhere. The maximum bending moment occurs at the cross
section where the force P is applied and where the shear force changes sign.
B
Shear
Fig. 4
Fig. 5
Shear
Use Eqs. 5.2 through 5.7 to sketch shear and moment diagrams for
simply supported beam shown in Fig. 1.
Plan the Solution We can use a free-body diagram of the beam AC in
Fig. 2 to determine the reactions at A and C. Since there is no distributed
load on the beam, p(x) = 0 everywhere. Because of the concentrated
couple at B, we need to consider two spans, 0 < x <a and a <x<L
Solution
Equilibrium-Reactions: We first determine the reactions A, and Cy.
-Mo
L
(1)
V(x)
A₂
Ma
Fig. 1
B
Fig. 2 A free-body diagram.
(2)
M(x)
(D)
(2)
(a) Load diagram.
(b) Shear diagram.
(3)
-My-)
L
(c) Moment diagram.
Мо
+C(μM)-
+C (ΣM)-
= 0:
-Mo - C,L=0→C, =
Mo
-0→A,
- 0:
A,L-Mo-
Shear Diagram: Equations 5.2, 5.4, and 5.6 involve the shear. Using
these equations and the load diagram in Fig. 3a, we can sketch V(x) pro-
gressively from x = 0 to x = L. It is convenient to sketch the shear and
moment diagrams directly below the load diagram. Each step involved in
sketching V(x) is numbered in Fig. 3b.
1. The shear at x=0" is zero.
2. The shear at x = 0 is determined from Eq. 5.4, that is, AV₁ =
A, M/L. Note that, because of the sign convention for shear,
an upward concentrated force causes an upward jump in the shear
diagram.
3. For 0<x<L.p(x) = 0. Therefore, from Eq. 5.2, dV/dx = 0, V(x)=
M/L = constant.
4. The reaction at C causes AVC --M/L, which closes the shear
diagram back to zero at x = L".
Moment Diagram: Equations 5.3, 5.5, and 5.7 relate to M(x) and can be
(4) used to sketch the moment diagram in Fig. 3c. Steps in the construction
of the moment diagram are explained and numbered.
1. The moment at x = 0 is zero (simply supported beam).
2. For <x<a, Eq. 5.3 gives dM/dx = V(x) = M/L = constant.
3. Atxa, M(a) can be determined from Eq. 5.7 as the area of the
rectangle under the shear curve from x = 0 to x = a. Therefore
M(a) -0- fgv(x)dx = M₁al L.
4. At xa there is a negative jump in moment given by Eq. 5.5. So
Moa
MoL-a)
L
L
M(a)=-
5.
Fig. 3 Load, shear, and moment
diagrams
6.
Mo=
For a<x<L, Eq. 5.3 gives dM/dx = V(x) = M/L = constant.
Equation 5.7 gives M(L) M(a) = V(x)dx = (M/L)(La),
which closes the moment diagram back to zero at x = L, as it should
[simple support at C].
Review the Solution The dimensions on the shear diagram (F) and the
moment diagram (F. L) are correct. Note that both the maximum
moment, Moall, and the minimum bending moment, -Mo(La)/L,
occur at the cross section where the concentrated couple acts. Compare
this example with the previous one, where there was a concentrated.
force.
Determine the reactions and sketch the shear and moment diagrams for
the beam shown in Fig. 1. (This beam is said to have an overhang BC.)
Show all significant values (that is, maxima, minima, positions of maxima
and minima, etc.) on the diagrams.
8 kN/m
16kN
Fig. 1
Plan the Solution We can use a free-body diagram of the whole beam
to compute the reactions. Then we can use Eqs. 5.2 through 5.7 to sketch
the V(x) and M(x) diagrams, as we did in Examples 5.7 and 5.8.
Solution
Equilibrium-Reactions: The reactions must be determined first. Figure 2
shows the appropriate free-body diagram.
18(4) 32 kN
-2m-l
16 KN
4m
2 m
Ay
By
Fig. 2 A free-body diagram.
+ C(ΣM)₁ = 0
0:
(8 kN/m)(4 m)(2 m) + (16 kN)(6 m) By(4 m) = 0
By=
=40 kN
+ C(ΣM)=
0:
-
A,(4 m) (8 kN/m)(4 m)(2 m) + (16 kN)(2m) = 0
A,
= 8 kN
Check: Is Fy=0?
8 3240 160? Yes
Ans.
Ans.
8 kN
V(KN)
(2)
(1)
(8)
8 kN/m
40 kN
(a) Load diagram
16kN
(6)
(5)
16
(7)
x(m)
It is convenient to sketch the V (Fig. 3b) and M (Fig. 3c) diagrams
directly below a sketch of the beam that has all of the loads and reactions
shown (Fig. 3a).
Shear Diagram: The following steps are used in sketching the shear
diagram (Fig. 3b).
1. V(0)=0 [no shear at end of beam].
2. V(0) 8 kN [Eq. 5.4].
3. dV/dx--8 kN/m [Eq. 5.2].
4. V(4) V(0) + (-8 kN/m)(4 m) -8-32-24 kN [Eq.5.6].
5. V(4) V(4) = 40 kN [Eq. 5.4].
6. dV/dx 0 [Eq. 5.2].
=
(3)
24H
7.
V(6) V(6)-16=0.
(b) Shear diagram.
8.
4
(1)
kNm)
-32H
(2
(3) & (4)
Im
(6)
(e) Moment diagram.
116
(8)
x(m)
Fig. 3 Shear and moment diagrams.
16kN
Shear
8 EN
Shear
ப
8 kN
རྒྱལ
(a)
Shear
16kN
AB
C
B
24 KN
40 kN
(b)
Fig. 4
Since dV/dx=-8 for 0 <x<4 m, and since V(0) = 8 kN, V = 0
at x = 1 m [Eq. 5.6].
Moment Diagram: The steps employed in constructing the moment dia-
gram (Fig. 3c) using Eqs. 5.2 through 5.7 will now be described:
1. M(0) = 0 [no moment at end of beam].
2. From dM/dx = V(x) we have the slope of M(x) going from +8
kN m/m at x=0 to zero at x = x=1 m. Therefore, the mo-
ment diagram for 0 < x <1 m must have the general shape.
[Eq.5.3].
3. M(x) is maximum where V(x) = 0 [Eq. 5.3].
4.
M(1) M(0)+5V(x)dx = (8 kN)(1 m) = 4 kN·m [Eq. 5.7; area
of triangle].
5. From x = 1 m to x 4 m, V(x) gets progressively more negative.
Therefore, M(x) must have the general shape [Eq.5.3].
6. M(4) M(0)+ V(x)dx=0+ (8 kN)(1 m)+(-24 kN)(3 m) =
-32 kN m (Eq. 5.7; net of areas of triangles]
7. dM/dx V(x)-16 kN [Eq.5.3].
8. M(6) M(4)+5V(x)dx = -32 kNm+ (16 kN)(2 m) = 0 [Eq.
5.7; no moment at end of beam].
The maximum shear occurs just to the left of the support at B and
has a magnitude of 24 kN. The maximum positive moment occurs where
V = 0 at x = 1 m and has a magnitude of 4 kN m; and the maximum
16kN negative moment occurs at the support B, and it has a magnitude of
32 kN·m.
(c)
Review the Solution By imagining cuts just to the right of A (Fig. 4a),
just to the left of B (Fig. 4b), and just to the right of B (Fig. 4c), we can
check the sign of the shear at these points.
The moment diagram is best checked by seeing if the sign of the
moment diagram corresponds to a reasonable deflected shape, that is,
concave upward where M(x) is positive and concave downward where
Deflection.
M positive
exaggerated
M negative
Fig. 5 A sketch showing the deflection of beam AC.
M(x) is negative, according to the sign convention that is given Fig. 5.6c.
Where M(x) = 0, the beam is locally straight, that is, it is neither concave
upward nor concave downward. We are able to sketch (Fig. 5) a plausi-
ble deflection curve that passes over the supports at A and B and that is
concave upward where M(x) is positive and concave downward where M
is negative. The distributed load between A and B and the concentrated
load at C could, indeed, cause the beam to deflect as sketched.
Mo
Fig. 1
B
Fig. 2 A free-body diagram.
(a) Load diagram.
Vix)
L
(2)
(1)
MIX)
(b) Shear diagram.
(1)
(2)
(3)
L
L
(c) Moment diagram.
load on the beam, p(x) = 0 everywhere. Because of the concentrated
couple at B, we need to consider two spans, 0<x<a and a<x<L.
Solution
Equilibrium-Reactions: We first determine the reactions A, and Cy.
- 0:
+C (ΣM)-
+C (ΣM)=
0:
-Mo
-Mo-CL-0→Cy
-
A,L. - Mo=0→A, M
Shear Diagram: Equations 5.2, 5.4, and 5.6 involve the shear. Using
these equations and the load diagram in Fig. 3a, we can sketch V(x) pro-
gressively from x = 0 to x-L. It is convenient to sketch the shear and
moment diagrams directly below the load diagram. Each step involved in
sketching V(x) is numbered in Fig. 3b.
1. The shear at x=0" is zero.
2. The shear at x=0 is determined from Eq. 5.4, that is, AV₁ =
A, M/L. Note that, because of the sign convention for shear,
an upward concentrated force causes an upward jump in the shear
diagram.
3. For 0<x<Lp(x) = 0. Therefore, from Eq. 5.2, dVidx = 0, V(x) =
ML constant.
4. The reaction at C causes AV-M/L, which closes the shear
diagram back to zero at x = L*.
Moment Diagram: Equations 5.3, 5.5, and 5.7 relate to M(x) and can be
(4) used to sketch the moment diagram in Fig. 3c. Steps in the construction.
of the moment diagram are explained and numbered.
(6)
1. The moment at x = 0 is zero (simply supported beam).
2. For 0<x<a, Eq. 5.3 gives dM/dx = V(x) = M/L = constant.
3. Atxa,M(a) can be determined from Eq. 5.7 as the area of the
rectangle under the shear curve from x = 0 to x = a." Therefore
M(a)-0fgV(x)dx = Moal L.
4. At x = a there is a negative jump in moment given by Eq.5.5. So
Moa
Mo(L-a)
L
L
M(a)=
5.
Fig. 3 Load, shear, and moment
diagrams.
6.
-
Mo=
For a <x<L, Eq. 5.3 gives dM/dx - V(x) - M/L - constant.
Equation 5.7 gives M(L) M(a) = f(x)dx = (M/L)(La),
which closes the moment diagram back to zero at x = L, as it should
[simple support at C].
Review the Solution The dimensions on the shear diagram (F) and the
moment diagram (F L) are correct. Note that both the maximum
moment, Moall, and the minimum bending moment, -Mo(La)/L,
occur at the cross section where the concentrated couple acts. Compare
this example with the previous one, where there was a concentrated
force.
dV
= p(x)
dx
dM
== V(x)
dx
AVA = Po
|AMB = MB
V2 V₁ =
x2
x1
p(x)dx
M₂-M₁ =
V(x) dx
M(x)
M(x)
DC1
V(x)
V(x)
(a) Positive V and M on section "x."
+x face
+y face
M
M V
V
V
(b) Positive shear.
(c) Positive moment.
(d) Positive V and M.
A
150 N
B
D
E
C
300 N
-100
10 mm-|-100 m
100 mm- -100 mm-
-150 mm-
Equation
dV
= p(x) (Eq. 5.2)
dx
AV Po (Eq. 54)
Load
Diagram
Shear
Diagram
1. Slope of shear diagram equals value of load
Moment
Diagram
M
V₁
Slope P₁
2. Jump in shear equals value of concentrated load
M₁
V₁
Positive V-jump
V₂
M₂
V₂
M₂
3. Change in shear equals area under distributed-load diagram
V₁₂- V₁ =
LP(r)dx
p(x)dx (Eq. 5.6)
dM
dx
=V(x) (Eq.5.3)
(Area)
M
My
V₂-V₁ = (Area)
4. Slope of moment diagram equals value of shear
5. Jump in moment equals (value of concentrated couple)
Mo
6. Change in moment equals area under shear diagram
AM -Mo (Eq. 5.5)
MV
M₂-My-
[*V(x)dx
V(x)dx (Eq.5.7)
Slope - V₁
M
Negative M-jump
M₂
Ma
(Area)y
V₂
M₂-M₁ = (Area)
M₂
Fig. 1
Use Eqs. 5.2 through 5.7 to sketch shear and moment diagrams for the
simply-supported beam shown in Fig. 1.
Plan the Solution We can use a free-body diagram of the beam AC to
determine the reactions at A and C. Since there is no distributed load on
the beam, p(x) = 0 everywhere. Because of the concentrated load at B.
we need to consider two spans, 0 <x<a and a <x<L
Solution
Equilibrium-Reactions: To determine the reactions A, and C,, we first
draw the free-body diagram of the entire beam AC (Fig. 2).
B
Vix) PU-
B
L-a
(a) Load diagram.
L
(3)
(2)
(1)
(4)
-2 F
P
(5)
(b) Shear diagram.
M(x)
(3)
(4)
(2)
(1)
(c) Moment diagram.
(6)
+C(ΣM)-
- 0:
+C(ΣM)
- 0:
Ay
Fig. 2 A free-body diagram.
Pa-CyL = 0, Cy = P(+)
A,L-P(La) 0, Ay
P(L-a)
-
L
Shear Diagram: Equations 5.2, 5.4, and 5.6 involve the shear. Using
these equations, we can sketch V(x) progressively from x = 0 to x = L.
It is convenient to sketch the shear and moment diagrams directly below
the load diagram (Fig. 3a). Each step involved in sketching V(x) is
numbered in Fig. 3b.
1. The shear at x = 0 is zero.
2. The shear at x=0 is determined from Eq. 5.4, that is, AVA
Ay
m
(5)
Fig. 3 Shear and moment diagrams.
P(La)
L
=
Note that, because of the sign convention for shear,
an upward concentrated force causes an upward jump in the shear
diagram.
3. For 0<x<a, p(x) = 0. Therefore, from Eq. 5.2, dV/dx = 0.
4. Atx a there is a downward force P, so AVB = -P.
dV
5. For a <x<L, p(x) = 0, so-
= 0.
dx
Pa
6. The reaction at C causes AVC which closes the shear diagram
back to zero at x=L'.
Moment Diagram: Equations 5.3, 5.5, and 5.7 relate to M(x) and can be
used to sketch the moment diagram in Fig. 3c. Steps in the construction
of the moment diagram are explained and numbered.
1. The moment at x=0 is zero [simply supported beam].
dM
dx
2. For 0<x<a, Eq. 5.3 gives = V(x)=-
P(L-a)
L
= constant.
3. Atxa, M(a) can be determined from Eq. 5.7 as the area of the
rectangle under the shear curve from x = 0 to x = a. Therefore
maximum bending moment.
-0-|V(x)dx=
P(L-a),
=
L
(a). M(a)
=
Pa(L-a)
L
is the
dM
-Pa
4. For a<x<L, Eq. 5.3 gives -
V(x)=
= constant.
dx
5. Equation 5.7 gives M(L) M(a) =
- [V(x)d
Pa
V(x)dx
(L-a),
which closes the moment diagram back to zero at x = L, as it should
[simple support at C].
Review the Solution The dimensions on the shear diagram (F) and the
moment diagram (FL) are correct. If we draw finite free-body diagrams
of the ends of the beam, we get Fig. 4. Therefore, the shear diagram in Fig.
36 has the correct signs according to the free-body sketches in Fig. 4 and the
sign convention in Fig. 5.6. The downward force will bend the beam as
shown in Fig. 5, which is consistent with the fact that the bending moment
is positive everywhere. The maximum bending moment occurs at the cross
section where the force P is applied and where the shear force changes sign.
B
Shear
Fig. 4
Fig. 5
Shear
Use Eqs. 5.2 through 5.7 to sketch shear and moment diagrams for
simply supported beam shown in Fig. 1.
Plan the Solution We can use a free-body diagram of the beam AC in
Fig. 2 to determine the reactions at A and C. Since there is no distributed
load on the beam, p(x) = 0 everywhere. Because of the concentrated
couple at B, we need to consider two spans, 0 < x <a and a <x<L
Solution
Equilibrium-Reactions: We first determine the reactions A, and Cy.
-Mo
L
(1)
V(x)
A₂
Ma
Fig. 1
B
Fig. 2 A free-body diagram.
(2)
M(x)
(D)
(2)
(a) Load diagram.
(b) Shear diagram.
(3)
-My-)
L
Мо
+C(μM)-
+C (ΣM)-
= 0:
-Mo - C,L=0→C, =
Mo
-0→A,
- 0:
A,L-Mo-
Shear Diagram: Equations 5.2, 5.4, and 5.6 involve the shear. Using
these equations and the load diagram in Fig. 3a, we can sketch V(x) pro-
gressively from x = 0 to x = L. It is convenient to sketch the shear and
moment diagrams directly below the load diagram. Each step involved in
sketching V(x) is numbered in Fig. 3b.
1. The shear at x=0" is zero.
2. The shear at x = 0 is determined from Eq. 5.4, that is, AV₁ =
A, M/L. Note that, because of the sign convention for shear,
an upward concentrated force causes an upward jump in the shear
diagram.
3. For 0<x<L.p(x) = 0. Therefore, from Eq. 5.2, dV/dx = 0, V(x)=
M/L = constant.
4. The reaction at C causes AVC --M/L, which closes the shear
diagram back to zero at x = L".
Moment Diagram: Equations 5.3, 5.5, and 5.7 relate to M(x) and can be
(4) used to sketch the moment diagram in Fig. 3c. Steps in the construction
of the moment diagram are explained and numbered.
1. The moment at x = 0 is zero (simply supported beam).
2. For <x<a, Eq. 5.3 gives dM/dx = V(x) = M/L = constant.
3. Atxa, M(a) can be determined from Eq. 5.7 as the area of the
rectangle under the shear curve from x = 0 to x = a. Therefore
M(a) -0- fgv(x)dx = M₁al L.
4. At xa there is a negative jump in moment given by Eq. 5.5. So
Moa
MoL-a)
L
L
M(a)=-
(c) Moment diagram.
5.
Fig. 3 Load, shear, and moment
diagrams
6.
Mo=
For a<x<L, Eq. 5.3 gives dM/dx = V(x) = M/L = constant.
Equation 5.7 gives M(L) M(a) = V(x)dx = (M/L)(La),
which closes the moment diagram back to zero at x = L, as it should
[simple support at C].
Review the Solution The dimensions on the shear diagram (F) and the
moment diagram (F. L) are correct. Note that both the maximum
moment, Moall, and the minimum bending moment, -Mo(La)/L,
occur at the cross section where the concentrated couple acts. Compare
this example with the previous one, where there was a concentrated.
force.
Determine the reactions and sketch the shear and moment diagrams for
the beam shown in Fig. 1. (This beam is said to have an overhang BC.)
Show all significant values (that is, maxima, minima, positions of maxima
and minima, etc.) on the diagrams.
8 kN/m
16kN
Fig. 1
Plan the Solution We can use a free-body diagram of the whole beam
to compute the reactions. Then we can use Eqs. 5.2 through 5.7 to sketch
the V(x) and M(x) diagrams, as we did in Examples 5.7 and 5.8.
Solution
Equilibrium-Reactions: The reactions must be determined first. Figure 2
shows the appropriate free-body diagram.
18(4) 32 kN
-2m-l
16 KN
4m
2 m
Ay
By
Fig. 2 A free-body diagram.
+ C(ΣM)₁ = 0
0:
(8 kN/m)(4 m)(2 m) + (16 kN)(6 m) By(4 m) = 0
By=
=40 kN
+ C(ΣM)=
0:
-
A,(4 m) (8 kN/m)(4 m)(2 m) + (16 kN)(2m) = 0
A,
= 8 kN
Check: Is Fy=0?
8 3240 160? Yes
Ans.
Ans.
8 kN
V(KN)
(2)
(1)
(8)
8 kN/m
40 kN
(a) Load diagram
16kN
(6)
(5)
16
(7)
x(m)
It is convenient to sketch the V (Fig. 3b) and M (Fig. 3c) diagrams
directly below a sketch of the beam that has all of the loads and reactions
shown (Fig. 3a).
Shear Diagram: The following steps are used in sketching the shear
diagram (Fig. 3b).
1. V(0)=0 [no shear at end of beam].
2. V(0) 8 kN [Eq. 5.4].
3. dV/dx--8 kN/m [Eq. 5.2].
4. V(4) V(0) + (-8 kN/m)(4 m) -8-32-24 kN [Eq.5.6].
5. V(4) V(4) = 40 kN [Eq. 5.4].
6. dV/dx 0 [Eq. 5.2].
=
(3)
24H
7.
V(6) V(6)-16=0.
(b) Shear diagram.
8.
4
(1)
kNm)
-32H
(2
(3) & (4)
Im
(6)
(e) Moment diagram.
116
(8)
x(m)
Fig. 3 Shear and moment diagrams.
16kN
Shear
8 EN
Shear
ப
8 kN
རྒྱལ
(a)
Shear
16kN
AB
C
B
24 KN
40 kN
(b)
Fig. 4
Since dV/dx=-8 for 0 <x<4 m, and since V(0) = 8 kN, V = 0
at x = 1 m [Eq. 5.6].
Moment Diagram: The steps employed in constructing the moment dia-
gram (Fig. 3c) using Eqs. 5.2 through 5.7 will now be described:
1. M(0) = 0 [no moment at end of beam].
2. From dM/dx = V(x) we have the slope of M(x) going from +8
kN m/m at x=0 to zero at x = x=1 m. Therefore, the mo-
ment diagram for 0 < x <1 m must have the general shape.
[Eq.5.3].
3. M(x) is maximum where V(x) = 0 [Eq. 5.3].
4.
M(1) M(0)+5V(x)dx = (8 kN)(1 m) = 4 kN·m [Eq. 5.7; area
of triangle].
5. From x = 1 m to x 4 m, V(x) gets progressively more negative.
Therefore, M(x) must have the general shape [Eq.5.3].
6. M(4) M(0)+ V(x)dx=0+ (8 kN)(1 m)+(-24 kN)(3 m) =
-32 kN m (Eq. 5.7; net of areas of triangles]
7. dM/dx V(x)-16 kN [Eq.5.3].
8. M(6) M(4)+5V(x)dx = -32 kNm+ (16 kN)(2 m) = 0 [Eq.
5.7; no moment at end of beam].
The maximum shear occurs just to the left of the support at B and
has a magnitude of 24 kN. The maximum positive moment occurs where
V = 0 at x = 1 m and has a magnitude of 4 kN m; and the maximum
16kN negative moment occurs at the support B, and it has a magnitude of
32 kN·m.
(c)
Review the Solution By imagining cuts just to the right of A (Fig. 4a),
just to the left of B (Fig. 4b), and just to the right of B (Fig. 4c), we can
check the sign of the shear at these points.
The moment diagram is best checked by seeing if the sign of the
moment diagram corresponds to a reasonable deflected shape, that is,
concave upward where M(x) is positive and concave downward where
Deflection.
M positive
exaggerated
M negative
Fig. 5 A sketch showing the deflection of beam AC.
M(x) is negative, according to the sign convention that is given Fig. 5.6c.
Where M(x) = 0, the beam is locally straight, that is, it is neither concave
upward nor concave downward. We are able to sketch (Fig. 5) a plausi-
ble deflection curve that passes over the supports at A and B and that is
concave upward where M(x) is positive and concave downward where M
is negative. The distributed load between A and B and the concentrated
load at C could, indeed, cause the beam to deflect as sketched.
Mo
Fig. 1
B
Fig. 2 A free-body diagram.
(a) Load diagram.
Vix)
L
(2)
(1)
MIX)
(b) Shear diagram.
(1)
(2)
(3)
L
L
(c) Moment diagram.
load on the beam, p(x) = 0 everywhere. Because of the concentrated
couple at B, we need to consider two spans, 0<x<a and a<x<L.
Solution
Equilibrium-Reactions: We first determine the reactions A, and Cy.
- 0:
+C (ΣM)-
+C (ΣM)=
0:
-Mo
-Mo-CL-0→Cy
-
A,L. - Mo=0→A, M
Shear Diagram: Equations 5.2, 5.4, and 5.6 involve the shear. Using
these equations and the load diagram in Fig. 3a, we can sketch V(x) pro-
gressively from x = 0 to x-L. It is convenient to sketch the shear and
moment diagrams directly below the load diagram. Each step involved in
sketching V(x) is numbered in Fig. 3b.
1. The shear at x=0" is zero.
2. The shear at x=0 is determined from Eq. 5.4, that is, AV₁ =
A, M/L. Note that, because of the sign convention for shear,
an upward concentrated force causes an upward jump in the shear
diagram.
3. For 0<x<Lp(x) = 0. Therefore, from Eq. 5.2, dVidx = 0, V(x) =
ML constant.
4. The reaction at C causes AV-M/L, which closes the shear
diagram back to zero at x = L*.
Moment Diagram: Equations 5.3, 5.5, and 5.7 relate to M(x) and can be
(4) used to sketch the moment diagram in Fig. 3c. Steps in the construction.
of the moment diagram are explained and numbered.
(6)
1. The moment at x = 0 is zero (simply supported beam).
2. For 0<x<a, Eq. 5.3 gives dM/dx = V(x) = M/L = constant.
3. Atxa,M(a) can be determined from Eq. 5.7 as the area of the
rectangle under the shear curve from x = 0 to x = a." Therefore
M(a)-0fgV(x)dx = Moal L.
4. At x = a there is a negative jump in moment given by Eq.5.5. So
Moa
Mo(L-a)
L
L
M(a)=
5.
Fig. 3 Load, shear, and moment
diagrams.
6.
-
Mo=
For a <x<L, Eq. 5.3 gives dM/dx - V(x) - M/L - constant.
Equation 5.7 gives M(L) M(a) = f(x)dx = (M/L)(La),
which closes the moment diagram back to zero at x = L, as it should
[simple support at C].
Review the Solution The dimensions on the shear diagram (F) and the
moment diagram (F L) are correct. Note that both the maximum
moment, Moall, and the minimum bending moment, -Mo(La)/L,
occur at the cross section where the concentrated couple acts. Compare
this example with the previous one, where there was a concentrated
force.
dV
= p(x)
dx
dM
== V(x)
dx
AVA = Po
|AMB = MB
V2 V₁ =
x2
x1
p(x)dx
M₂-M₁ =
V(x) dx
M(x) M(x)
כו
C1
V(x)
V(x)
(a) Positive V and M on section "x."
+x face
+y face
M
M V
V
V
(b) Positive shear.
(c) Positive moment.
(d) Positive V and M.
10 kN
20 kN
20 kN
B
D
E
||1m|1m|1m|
-2 m-
Equation
dV
= p(x) (Eq. 5.2)
dx
AV Po (Eq. 54)
Load
Diagram
Shear
Diagram
1. Slope of shear diagram equals value of load
Moment
Diagram
M
V₁
Slope P₁
2. Jump in shear equals value of concentrated load
M₁
V₁
Positive V-jump
V₂
M₂
V₂
M₂
3. Change in shear equals area under distributed-load diagram
V₁₂- V₁ =
LP(r)dx
p(x)dx (Eq. 5.6)
dM
dx
=V(x) (Eq.5.3)
(Area)
M
My
V₂-V₁ = (Area)
4. Slope of moment diagram equals value of shear
5. Jump in moment equals (value of concentrated couple)
Mo
6. Change in moment equals area under shear diagram
AM -Mo (Eq. 5.5)
MV
M₂-My-
[*V(x)dx
V(x)dx (Eq.5.7)
Slope - V₁
M
Negative M-jump
M₂
Ma
(Area)y
V₂
M₂-M₁ = (Area)
M₂
Fig. 1
Use Eqs. 5.2 through 5.7 to sketch shear and moment diagrams for the
simply-supported beam shown in Fig. 1.
Plan the Solution We can use a free-body diagram of the beam AC to
determine the reactions at A and C. Since there is no distributed load on
the beam, p(x) = 0 everywhere. Because of the concentrated load at B.
we need to consider two spans, 0 <x<a and a <x<L
Solution
Equilibrium-Reactions: To determine the reactions A, and C,, we first
draw the free-body diagram of the entire beam AC (Fig. 2).
B
Vix) PU-
L
B
L-a
(a) Load diagram.
(3)
(2)
(1)
(4)
-2 F
A
P
(5)
(b) Shear diagram.
M(x)
(3)
(4)
(2)
(1)
(c) Moment diagram.
(6)
+C(ΣM)-
- 0:
+C(ΣM)
- 0:
Ay
Fig. 2 A free-body diagram.
Pa-CyL = 0, Cy = P(+)
A,L-P(La) 0, Ay
P(L-a)
-
L
Shear Diagram: Equations 5.2, 5.4, and 5.6 involve the shear. Using
these equations, we can sketch V(x) progressively from x = 0 to x = L.
It is convenient to sketch the shear and moment diagrams directly below
the load diagram (Fig. 3a). Each step involved in sketching V(x) is
numbered in Fig. 3b.
1. The shear at x = 0 is zero.
2. The shear at x=0 is determined from Eq. 5.4, that is, AVA
Ay
m
(5)
Fig. 3 Shear and moment diagrams.
P(La)
L
=
Note that, because of the sign convention for shear,
an upward concentrated force causes an upward jump in the shear
diagram.
3. For 0<x<a, p(x) = 0. Therefore, from Eq. 5.2, dV/dx = 0.
4. Atx a there is a downward force P, so AVB = -P.
dV
5. For a <x<L, p(x) = 0, so-
= 0.
dx
Pa
6. The reaction at C causes AVC which closes the shear diagram
back to zero at x=L'.
Moment Diagram: Equations 5.3, 5.5, and 5.7 relate to M(x) and can be
used to sketch the moment diagram in Fig. 3c. Steps in the construction
of the moment diagram are explained and numbered.
1. The moment at x=0 is zero [simply supported beam].
dM
dx
2. For 0<x<a, Eq. 5.3 gives = V(x)=-
P(L-a)
L
= constant.
3. Atxa, M(a) can be determined from Eq. 5.7 as the area of the
rectangle under the shear curve from x = 0 to x = a. Therefore
maximum bending moment.
-0-|V(x)dx=
P(L-a),
=
L
(a). M(a)
=
Pa(L-a)
L
is the
dM
-Pa
4. For a<x<L, Eq. 5.3 gives -
V(x)=
= constant.
dx
5. Equation 5.7 gives M(L) M(a) =
- [V(x)d
Pa
V(x)dx
(L-a),
which closes the moment diagram back to zero at x = L, as it should
[simple support at C].
Review the Solution The dimensions on the shear diagram (F) and the
moment diagram (FL) are correct. If we draw finite free-body diagrams
of the ends of the beam, we get Fig. 4. Therefore, the shear diagram in Fig.
36 has the correct signs according to the free-body sketches in Fig. 4 and the
sign convention in Fig. 5.6. The downward force will bend the beam as
shown in Fig. 5, which is consistent with the fact that the bending moment
is positive everywhere. The maximum bending moment occurs at the cross
section where the force P is applied and where the shear force changes sign.
B
Shear
Fig. 4
Fig. 5
Shear
Use Eqs. 5.2 through 5.7 to sketch shear and moment diagrams for
simply supported beam shown in Fig. 1.
Plan the Solution We can use a free-body diagram of the beam AC in
Fig. 2 to determine the reactions at A and C. Since there is no distributed
load on the beam, p(x) = 0 everywhere. Because of the concentrated
couple at B, we need to consider two spans, 0 < x <a and a <x<L
Solution
Equilibrium-Reactions: We first determine the reactions A, and Cy.
-Mo
L
(1)
V(x)
A₂
Ma
Fig. 1
B
Fig. 2 A free-body diagram.
(2)
M(x)
(D)
(2)
(a) Load diagram.
(b) Shear diagram.
(3)
-My-)
L
(c) Moment diagram.
Мо
+C(μM)-
+C (ΣM)-
= 0:
-Mo - C,L=0→C, =
Mo
-0→A,
- 0:
A,L-Mo-
Shear Diagram: Equations 5.2, 5.4, and 5.6 involve the shear. Using
these equations and the load diagram in Fig. 3a, we can sketch V(x) pro-
gressively from x = 0 to x = L. It is convenient to sketch the shear and
moment diagrams directly below the load diagram. Each step involved in
sketching V(x) is numbered in Fig. 3b.
1. The shear at x=0" is zero.
2. The shear at x = 0 is determined from Eq. 5.4, that is, AV₁ =
A, M/L. Note that, because of the sign convention for shear,
an upward concentrated force causes an upward jump in the shear
diagram.
3. For 0<x<L.p(x) = 0. Therefore, from Eq. 5.2, dV/dx = 0, V(x)=
M/L = constant.
4. The reaction at C causes AVC --M/L, which closes the shear
diagram back to zero at x = L".
Moment Diagram: Equations 5.3, 5.5, and 5.7 relate to M(x) and can be
(4) used to sketch the moment diagram in Fig. 3c. Steps in the construction
of the moment diagram are explained and numbered.
1. The moment at x = 0 is zero (simply supported beam).
2. For <x<a, Eq. 5.3 gives dM/dx = V(x) = M/L = constant.
3. Atxa, M(a) can be determined from Eq. 5.7 as the area of the
rectangle under the shear curve from x = 0 to x = a. Therefore
M(a) -0- fgv(x)dx = M₁al L.
4. At xa there is a negative jump in moment given by Eq. 5.5. So
Moa
MoL-a)
L
L
M(a)=-
5.
Fig. 3 Load, shear, and moment
diagrams
6.
Mo=
For a<x<L, Eq. 5.3 gives dM/dx = V(x) = M/L = constant.
Equation 5.7 gives M(L) M(a) = V(x)dx = (M/L)(La),
which closes the moment diagram back to zero at x = L, as it should
[simple support at C].
Review the Solution The dimensions on the shear diagram (F) and the
moment diagram (F. L) are correct. Note that both the maximum
moment, Moall, and the minimum bending moment, -Mo(La)/L,
occur at the cross section where the concentrated couple acts. Compare
this example with the previous one, where there was a concentrated.
force.
Determine the reactions and sketch the shear and moment diagrams for
the beam shown in Fig. 1. (This beam is said to have an overhang BC.)
Show all significant values (that is, maxima, minima, positions of maxima
and minima, etc.) on the diagrams.
8 kN/m
16kN
Fig. 1
Plan the Solution We can use a free-body diagram of the whole beam
to compute the reactions. Then we can use Eqs. 5.2 through 5.7 to sketch
the V(x) and M(x) diagrams, as we did in Examples 5.7 and 5.8.
Solution
Equilibrium-Reactions: The reactions must be determined first. Figure 2
shows the appropriate free-body diagram.
18(4) 32 kN
-2m-l
16 KN
4m
2 m
Ay
By
Fig. 2 A free-body diagram.
+ C(ΣM)₁ = 0
0:
(8 kN/m)(4 m)(2 m) + (16 kN)(6 m) By(4 m) = 0
By=
=40 kN
+ C(ΣM)=
0:
-
A,(4 m) (8 kN/m)(4 m)(2 m) + (16 kN)(2m) = 0
A,
= 8 kN
Check: Is Fy=0?
8 3240 160? Yes
Ans.
Ans.
8 kN
V(KN)
(2)
(1)
(8)
8 kN/m
40 kN
(a) Load diagram
16kN
(6)
(5)
16
(7)
x(m)
It is convenient to sketch the V (Fig. 3b) and M (Fig. 3c) diagrams
directly below a sketch of the beam that has all of the loads and reactions
shown (Fig. 3a).
Shear Diagram: The following steps are used in sketching the shear
diagram (Fig. 3b).
1. V(0)=0 [no shear at end of beam].
2. V(0) 8 kN [Eq. 5.4].
3. dV/dx--8 kN/m [Eq. 5.2].
4. V(4) V(0) + (-8 kN/m)(4 m) -8-32-24 kN [Eq.5.6].
5. V(4) V(4) = 40 kN [Eq. 5.4].
6. dV/dx 0 [Eq. 5.2].
=
(3)
24H
7.
V(6) V(6)-16=0.
(b) Shear diagram.
8.
4
(1)
kNm)
-32H
(2
(3) & (4)
Im
(6)
(e) Moment diagram.
116
(8)
x(m)
Fig. 3 Shear and moment diagrams.
16kN
Shear
8 EN
Shear
ப
8 kN
རྒྱལ
(a)
Shear
16kN
AB
C
B
24 KN
40 kN
(b)
Fig. 4
Since dV/dx=-8 for 0 <x<4 m, and since V(0) = 8 kN, V = 0
at x = 1 m [Eq. 5.6].
Moment Diagram: The steps employed in constructing the moment dia-
gram (Fig. 3c) using Eqs. 5.2 through 5.7 will now be described:
1. M(0) = 0 [no moment at end of beam].
2. From dM/dx = V(x) we have the slope of M(x) going from +8
kN m/m at x=0 to zero at x = x=1 m. Therefore, the mo-
ment diagram for 0 < x <1 m must have the general shape.
[Eq.5.3].
3. M(x) is maximum where V(x) = 0 [Eq. 5.3].
4.
M(1) M(0)+5V(x)dx = (8 kN)(1 m) = 4 kN·m [Eq. 5.7; area
of triangle].
5. From x = 1 m to x 4 m, V(x) gets progressively more negative.
Therefore, M(x) must have the general shape [Eq.5.3].
6. M(4) M(0)+ V(x)dx=0+ (8 kN)(1 m)+(-24 kN)(3 m) =
-32 kN m (Eq. 5.7; net of areas of triangles]
7. dM/dx V(x)-16 kN [Eq.5.3].
8. M(6) M(4)+5V(x)dx = -32 kNm+ (16 kN)(2 m) = 0 [Eq.
5.7; no moment at end of beam].
The maximum shear occurs just to the left of the support at B and
has a magnitude of 24 kN. The maximum positive moment occurs where
V = 0 at x = 1 m and has a magnitude of 4 kN m; and the maximum
16kN negative moment occurs at the support B, and it has a magnitude of
32 kN·m.
(c)
Review the Solution By imagining cuts just to the right of A (Fig. 4a),
just to the left of B (Fig. 4b), and just to the right of B (Fig. 4c), we can
check the sign of the shear at these points.
The moment diagram is best checked by seeing if the sign of the
moment diagram corresponds to a reasonable deflected shape, that is,
concave upward where M(x) is positive and concave downward where
Deflection.
M positive
exaggerated
M negative
Fig. 5 A sketch showing the deflection of beam AC.
M(x) is negative, according to the sign convention that is given Fig. 5.6c.
Where M(x) = 0, the beam is locally straight, that is, it is neither concave
upward nor concave downward. We are able to sketch (Fig. 5) a plausi-
ble deflection curve that passes over the supports at A and B and that is
concave upward where M(x) is positive and concave downward where M
is negative. The distributed load between A and B and the concentrated
load at C could, indeed, cause the beam to deflect as sketched.
Mo
Fig. 1
B
Fig. 2 A free-body diagram.
(a) Load diagram.
Vix)
L
(2)
(1)
MIX)
(b) Shear diagram.
(1)
(2)
(3)
L
L
(c) Moment diagram.
load on the beam, p(x) = 0 everywhere. Because of the concentrated
couple at B, we need to consider two spans, 0<x<a and a<x<L.
Solution
Equilibrium-Reactions: We first determine the reactions A, and Cy.
- 0:
+C (ΣM)-
+C (ΣM)=
0:
-Mo
-Mo-CL-0→Cy
-
A,L. - Mo=0→A, M
Shear Diagram: Equations 5.2, 5.4, and 5.6 involve the shear. Using
these equations and the load diagram in Fig. 3a, we can sketch V(x) pro-
gressively from x = 0 to x-L. It is convenient to sketch the shear and
moment diagrams directly below the load diagram. Each step involved in
sketching V(x) is numbered in Fig. 3b.
1. The shear at x=0" is zero.
2. The shear at x=0 is determined from Eq. 5.4, that is, AV₁ =
A, M/L. Note that, because of the sign convention for shear,
an upward concentrated force causes an upward jump in the shear
diagram.
3. For 0<x<Lp(x) = 0. Therefore, from Eq. 5.2, dVidx = 0, V(x) =
ML constant.
4. The reaction at C causes AV-M/L, which closes the shear
diagram back to zero at x = L*.
Moment Diagram: Equations 5.3, 5.5, and 5.7 relate to M(x) and can be
(4) used to sketch the moment diagram in Fig. 3c. Steps in the construction.
of the moment diagram are explained and numbered.
(6)
1. The moment at x = 0 is zero (simply supported beam).
2. For 0<x<a, Eq. 5.3 gives dM/dx = V(x) = M/L = constant.
3. Atxa,M(a) can be determined from Eq. 5.7 as the area of the
rectangle under the shear curve from x = 0 to x = a." Therefore
M(a)-0fgV(x)dx = Moal L.
4. At x = a there is a negative jump in moment given by Eq.5.5. So
Moa
Mo(L-a)
L
L
M(a)=
5.
Fig. 3 Load, shear, and moment
diagrams.
6.
-
Mo=
For a <x<L, Eq. 5.3 gives dM/dx - V(x) - M/L - constant.
Equation 5.7 gives M(L) M(a) = f(x)dx = (M/L)(La),
which closes the moment diagram back to zero at x = L, as it should
[simple support at C].
Review the Solution The dimensions on the shear diagram (F) and the
moment diagram (F L) are correct. Note that both the maximum
moment, Moall, and the minimum bending moment, -Mo(La)/L,
occur at the cross section where the concentrated couple acts. Compare
this example with the previous one, where there was a concentrated
force.
dV
= p(x)
dx
dM
== V(x)
dx
AVA = Po
|AMB = MB
V2 V₁ =
x2
x1
p(x)dx
M₂-M₁ =
V(x) dx
M(x)
M(x)
DC1
V(x)
V(x)
(a) Positive V and M on section "x."
+x face
+y face
M
M V
V
V
(b) Positive shear.
(c) Positive moment.
(d) Positive V and M.
E
500 lb
B
C
-24 in.-
40 in.-
-48 in.
D
50 in.
x
Equation
dV
= p(x) (Eq. 5.2)
dx
AV Po (Eq. 54)
Load
Diagram
Shear
Diagram
1. Slope of shear diagram equals value of load
Moment
Diagram
M
V₁
Slope P₁
2. Jump in shear equals value of concentrated load
M₁
V₁
Positive V-jump
V₂
M₂
V₂
M₂
3. Change in shear equals area under distributed-load diagram
V₁₂- V₁ =
LP(r)dx
p(x)dx (Eq. 5.6)
dM
dx
=V(x) (Eq.5.3)
(Area)
M
My
V₂-V₁ = (Area)
4. Slope of moment diagram equals value of shear
5. Jump in moment equals (value of concentrated couple)
Mo
6. Change in moment equals area under shear diagram
AM -Mo (Eq. 5.5)
MV
M₂-My-
[*V(x)dx
V(x)dx (Eq.5.7)
Slope - V₁
M
Negative M-jump
M₂
M₂
(Area)y
V₂
M₂-M₁ = (Area)
M₂
Fig. 1
Use Eqs. 5.2 through 5.7 to sketch shear and moment diagrams for the
simply-supported beam shown in Fig. 1.
Plan the Solution We can use a free-body diagram of the beam AC to
determine the reactions at A and C. Since there is no distributed load on
the beam, p(x) = 0 everywhere. Because of the concentrated load at B.
we need to consider two spans, 0 <x<a and a <x<L
Solution
Equilibrium-Reactions: To determine the reactions A, and C,, we first
draw the free-body diagram of the entire beam AC (Fig. 2).
B
Vix) PU-
B
L-a
(a) Load diagram.
L
(3)
(2)
(1)
(4)
-2 F
P
(5)
(b) Shear diagram.
M(x)
(3)
(4)
(2)
(1)
(c) Moment diagram.
(6)
+C(ΣM)-
- 0:
+C(ΣM)
- 0:
Ay
Fig. 2 A free-body diagram.
Pa-CyL = 0, Cy = P(+)
A,L-P(La) 0, Ay
P(L-a)
-
L
Shear Diagram: Equations 5.2, 5.4, and 5.6 involve the shear. Using
these equations, we can sketch V(x) progressively from x = 0 to x = L.
It is convenient to sketch the shear and moment diagrams directly below
the load diagram (Fig. 3a). Each step involved in sketching V(x) is
numbered in Fig. 3b.
1. The shear at x = 0 is zero.
2. The shear at x=0 is determined from Eq. 5.4, that is, AVA
Ay
m
(5)
Fig. 3 Shear and moment diagrams.
P(La)
L
=
Note that, because of the sign convention for shear,
an upward concentrated force causes an upward jump in the shear
diagram.
3. For 0<x<a, p(x) = 0. Therefore, from Eq. 5.2, dV/dx = 0.
4. Atx a there is a downward force P, so AVB = -P.
dV
5. For a <x<L, p(x) = 0, so-
= 0.
dx
Pa
6. The reaction at C causes AVC which closes the shear diagram
back to zero at x=L'.
Moment Diagram: Equations 5.3, 5.5, and 5.7 relate to M(x) and can be
used to sketch the moment diagram in Fig. 3c. Steps in the construction
of the moment diagram are explained and numbered.
1. The moment at x=0 is zero [simply supported beam].
dM
dx
2. For 0<x<a, Eq. 5.3 gives = V(x)=-
P(L-a)
L
= constant.
3. Atxa, M(a) can be determined from Eq. 5.7 as the area of the
rectangle under the shear curve from x = 0 to x = a. Therefore
maximum bending moment.
-0-|V(x)dx=
P(L-a),
=
L
(a). M(a)
=
Pa(L-a)
L
is the
dM
-Pa
4. For a<x<L, Eq. 5.3 gives -
V(x)=
= constant.
dx
5. Equation 5.7 gives M(L) M(a) =
- [V(x)d
Pa
V(x)dx
(L-a),
which closes the moment diagram back to zero at x = L, as it should
[simple support at C].
Review the Solution The dimensions on the shear diagram (F) and the
moment diagram (FL) are correct. If we draw finite free-body diagrams
of the ends of the beam, we get Fig. 4. Therefore, the shear diagram in Fig.
36 has the correct signs according to the free-body sketches in Fig. 4 and the
sign convention in Fig. 5.6. The downward force will bend the beam as
shown in Fig. 5, which is consistent with the fact that the bending moment
is positive everywhere. The maximum bending moment occurs at the cross
section where the force P is applied and where the shear force changes sign.
B
Shear
Fig. 4
Fig. 5
Shear
Use Eqs. 5.2 through 5.7 to sketch shear and moment diagrams for
simply supported beam shown in Fig. 1.
Plan the Solution We can use a free-body diagram of the beam AC in
Fig. 2 to determine the reactions at A and C. Since there is no distributed
load on the beam, p(x) = 0 everywhere. Because of the concentrated
couple at B, we need to consider two spans, 0 < x <a and a <x<L
Solution
Equilibrium-Reactions: We first determine the reactions A, and Cy.
-Mo
L
(1)
V(x)
A₂
Ma
Fig. 1
B
Fig. 2 A free-body diagram.
(2)
M(x)
(D)
(2)
(a) Load diagram.
(b) Shear diagram.
(3)
-My-)
L
(c) Moment diagram.
Мо
+C(μM)-
+C (ΣM)-
= 0:
-Mo - C,L=0→C, =
Mo
-0→A,
- 0:
A,L-Mo-
Shear Diagram: Equations 5.2, 5.4, and 5.6 involve the shear. Using
these equations and the load diagram in Fig. 3a, we can sketch V(x) pro-
gressively from x = 0 to x = L. It is convenient to sketch the shear and
moment diagrams directly below the load diagram. Each step involved in
sketching V(x) is numbered in Fig. 3b.
1. The shear at x=0" is zero.
2. The shear at x = 0 is determined from Eq. 5.4, that is, AV₁ =
A, M/L. Note that, because of the sign convention for shear,
an upward concentrated force causes an upward jump in the shear
diagram.
3. For 0<x<L.p(x) = 0. Therefore, from Eq. 5.2, dV/dx = 0, V(x)=
M/L = constant.
4. The reaction at C causes AVC --M/L, which closes the shear
diagram back to zero at x = L".
Moment Diagram: Equations 5.3, 5.5, and 5.7 relate to M(x) and can be
(4) used to sketch the moment diagram in Fig. 3c. Steps in the construction
of the moment diagram are explained and numbered.
1. The moment at x = 0 is zero (simply supported beam).
2. For <x<a, Eq. 5.3 gives dM/dx = V(x) = M/L = constant.
3. Atxa, M(a) can be determined from Eq. 5.7 as the area of the
rectangle under the shear curve from x = 0 to x = a. Therefore
M(a) -0- fgv(x)dx = M₁al L.
4. At xa there is a negative jump in moment given by Eq. 5.5. So
Moa
MoL-a)
L
L
M(a)=-
5.
Fig. 3 Load, shear, and moment
diagrams
6.
Mo=
For a<x<L, Eq. 5.3 gives dM/dx = V(x) = M/L = constant.
Equation 5.7 gives M(L) M(a) = V(x)dx = (M/L)(La),
which closes the moment diagram back to zero at x = L, as it should
[simple support at C].
Review the Solution The dimensions on the shear diagram (F) and the
moment diagram (F. L) are correct. Note that both the maximum
moment, Moall, and the minimum bending moment, -Mo(La)/L,
occur at the cross section where the concentrated couple acts. Compare
this example with the previous one, where there was a concentrated.
force.
Determine the reactions and sketch the shear and moment diagrams for
the beam shown in Fig. 1. (This beam is said to have an overhang BC.)
Show all significant values (that is, maxima, minima, positions of maxima
and minima, etc.) on the diagrams.
8 kN/m
16kN
Fig. 1
Plan the Solution We can use a free-body diagram of the whole beam
to compute the reactions. Then we can use Eqs. 5.2 through 5.7 to sketch
the V(x) and M(x) diagrams, as we did in Examples 5.7 and 5.8.
Solution
Equilibrium-Reactions: The reactions must be determined first. Figure 2
shows the appropriate free-body diagram.
18(4) 32 kN
-2m-l
16 KN
4m
2 m
Ay
By
Fig. 2 A free-body diagram.
+ C(ΣM)₁ = 0
0:
(8 kN/m)(4 m)(2 m) + (16 kN)(6 m) By(4 m) = 0
By=
=40 kN
+ C(ΣM)=
0:
-
A,(4 m) (8 kN/m)(4 m)(2 m) + (16 kN)(2m) = 0
A,
= 8 kN
Check: Is Fy=0?
8 3240 160? Yes
Ans.
Ans.
8 kN
V(KN)
(2)
(1)
(8)
8 kN/m
40 kN
(a) Load diagram
16kN
(6)
(5)
16
(7)
x(m)
It is convenient to sketch the V (Fig. 3b) and M (Fig. 3c) diagrams
directly below a sketch of the beam that has all of the loads and reactions
shown (Fig. 3a).
Shear Diagram: The following steps are used in sketching the shear
diagram (Fig. 3b).
1. V(0)=0 [no shear at end of beam].
2. V(0) 8 kN [Eq. 5.4].
3. dV/dx--8 kN/m [Eq. 5.2].
4. V(4) V(0) + (-8 kN/m)(4 m) -8-32-24 kN [Eq.5.6].
5. V(4) V(4) = 40 kN [Eq. 5.4].
6. dV/dx 0 [Eq. 5.2].
=
(3)
24H
7.
V(6) V(6)-16=0.
(b) Shear diagram.
8.
4
(1)
kNm)
-32H
(2
(3) & (4)
Im
(6)
(e) Moment diagram.
116
(8)
x(m)
Fig. 3 Shear and moment diagrams.
16kN
Shear
8 EN
Shear
ப
8 kN
རྒྱལ
(a)
Shear
16kN
AB
C
B
24 KN
40 kN
(b)
Fig. 4
Since dV/dx=-8 for 0 <x<4 m, and since V(0) = 8 kN, V = 0
at x = 1 m [Eq. 5.6].
Moment Diagram: The steps employed in constructing the moment dia-
gram (Fig. 3c) using Eqs. 5.2 through 5.7 will now be described:
1. M(0) = 0 [no moment at end of beam].
2. From dM/dx = V(x) we have the slope of M(x) going from +8
kN m/m at x=0 to zero at x = x=1 m. Therefore, the mo-
ment diagram for 0 < x <1 m must have the general shape.
[Eq.5.3].
3. M(x) is maximum where V(x) = 0 [Eq. 5.3].
4.
M(1) M(0)+5V(x)dx = (8 kN)(1 m) = 4 kN·m [Eq. 5.7; area
of triangle].
5. From x = 1 m to x 4 m, V(x) gets progressively more negative.
Therefore, M(x) must have the general shape [Eq.5.3].
6. M(4) M(0)+ V(x)dx=0+ (8 kN)(1 m)+(-24 kN)(3 m) =
-32 kN m (Eq. 5.7; net of areas of triangles]
7. dM/dx V(x)-16 kN [Eq.5.3].
8. M(6) M(4)+5V(x)dx = -32 kNm+ (16 kN)(2 m) = 0 [Eq.
5.7; no moment at end of beam].
The maximum shear occurs just to the left of the support at B and
has a magnitude of 24 kN. The maximum positive moment occurs where
V = 0 at x = 1 m and has a magnitude of 4 kN m; and the maximum
16kN negative moment occurs at the support B, and it has a magnitude of
32 kN·m.
(c)
Review the Solution By imagining cuts just to the right of A (Fig. 4a),
just to the left of B (Fig. 4b), and just to the right of B (Fig. 4c), we can
check the sign of the shear at these points.
The moment diagram is best checked by seeing if the sign of the
moment diagram corresponds to a reasonable deflected shape, that is,
concave upward where M(x) is positive and concave downward where
Deflection.
M positive
exaggerated
M negative
Fig. 5 A sketch showing the deflection of beam AC.
M(x) is negative, according to the sign convention that is given Fig. 5.6c.
Where M(x) = 0, the beam is locally straight, that is, it is neither concave
upward nor concave downward. We are able to sketch (Fig. 5) a plausi-
ble deflection curve that passes over the supports at A and B and that is
concave upward where M(x) is positive and concave downward where M
is negative. The distributed load between A and B and the concentrated
load at C could, indeed, cause the beam to deflect as sketched.
Mo
Fig. 1
B
Fig. 2 A free-body diagram.
(a) Load diagram.
Vix)
L
(2)
(1)
MIX)
(b) Shear diagram.
(1)
(2)
(3)
L
L
(c) Moment diagram.
load on the beam, p(x) = 0 everywhere. Because of the concentrated
couple at B, we need to consider two spans, 0<x<a and a<x<L.
Solution
Equilibrium-Reactions: We first determine the reactions A, and Cy.
- 0:
+C (ΣM)-
+C (ΣM)=
0:
-Mo
-Mo-CL-0→Cy
-
A,L. - Mo=0→A, M
Shear Diagram: Equations 5.2, 5.4, and 5.6 involve the shear. Using
these equations and the load diagram in Fig. 3a, we can sketch V(x) pro-
gressively from x = 0 to x-L. It is convenient to sketch the shear and
moment diagrams directly below the load diagram. Each step involved in
sketching V(x) is numbered in Fig. 3b.
1. The shear at x=0" is zero.
2. The shear at x=0 is determined from Eq. 5.4, that is, AV₁ =
A, M/L. Note that, because of the sign convention for shear,
an upward concentrated force causes an upward jump in the shear
diagram.
3. For 0<x<Lp(x) = 0. Therefore, from Eq. 5.2, dVidx = 0, V(x) =
ML constant.
4. The reaction at C causes AV-M/L, which closes the shear
diagram back to zero at x = L*.
Moment Diagram: Equations 5.3, 5.5, and 5.7 relate to M(x) and can be
(4) used to sketch the moment diagram in Fig. 3c. Steps in the construction.
of the moment diagram are explained and numbered.
(6)
1. The moment at x = 0 is zero (simply supported beam).
2. For 0<x<a, Eq. 5.3 gives dM/dx = V(x) = M/L = constant.
3. Atxa,M(a) can be determined from Eq. 5.7 as the area of the
rectangle under the shear curve from x = 0 to x = a." Therefore
M(a)-0fgV(x)dx = Moal L.
4. At x = a there is a negative jump in moment given by Eq.5.5. So
Moa
Mo(L-a)
L
L
M(a)=
5.
Fig. 3 Load, shear, and moment
diagrams.
6.
-
Mo=
For a <x<L, Eq. 5.3 gives dM/dx - V(x) - M/L - constant.
Equation 5.7 gives M(L) M(a) = f(x)dx = (M/L)(La),
which closes the moment diagram back to zero at x = L, as it should
[simple support at C].
Review the Solution The dimensions on the shear diagram (F) and the
moment diagram (F L) are correct. Note that both the maximum
moment, Moall, and the minimum bending moment, -Mo(La)/L,
occur at the cross section where the concentrated couple acts. Compare
this example with the previous one, where there was a concentrated
force.
dV
= p(x)
dx
dM
== V(x)
dx
AVA = Po
|AMB = MB
V2 V₁ =
x2
x1
p(x)dx
M₂-M₁ =
V(x) dx
M(x) M(x)
כו
C1
V(x)
V(x)
(a) Positive V and M on section "x."
+x face
+y face
M
M V
V
V
(b) Positive shear.
(c) Positive moment.
(d) Positive V and M.
22
2P
2P
P
B
Equation
dV
= p(x) (Eq. 5.2)
dx
AV Po (Eq. 54)
Load
Diagram
Shear
Diagram
1. Slope of shear diagram equals value of load
Moment
Diagram
M
V₁
Slope P₁
2. Jump in shear equals value of concentrated load
M₁
V₁
Positive V-jump
V₂
M₂
V₂
M₂
3. Change in shear equals area under distributed-load diagram
V₁₂- V₁ =
LP(r)dx
p(x)dx (Eq. 5.6)
dM
dx
=V(x) (Eq.5.3)
(Area)
M
My
V₂-V₁ = (Area)
4. Slope of moment diagram equals value of shear
5. Jump in moment equals (value of concentrated couple)
Mo
6. Change in moment equals area under shear diagram
AM -Mo (Eq. 5.5)
MV
M₂-My-
[*V(x)dx
V(x)dx (Eq.5.7)
Slope - V₁
M
Negative M-jump
M₂
M₂
(Area)y
V₂
M₂-M₁ = (Area)
M₂
Fig. 1
Use Eqs. 5.2 through 5.7 to sketch shear and moment diagrams for the
simply-supported beam shown in Fig. 1.
Plan the Solution We can use a free-body diagram of the beam AC to
determine the reactions at A and C. Since there is no distributed load on
the beam, p(x) = 0 everywhere. Because of the concentrated load at B.
we need to consider two spans, 0 <x<a and a <x<L
Solution
Equilibrium-Reactions: To determine the reactions A, and C,, we first
draw the free-body diagram of the entire beam AC (Fig. 2).
B
Vix) PU-
B
L-a
(a) Load diagram.
L
(3)
(2)
(1)
(4)
-2 F
P
(5)
(b) Shear diagram.
M(x)
(3)
(4)
(2)
(1)
(c) Moment diagram.
(6)
+C(ΣM)-
- 0:
+C(ΣM)
- 0:
Ay
Fig. 2 A free-body diagram.
Pa-CyL = 0, Cy = P(+)
A,L-P(La) 0, Ay
P(L-a)
-
L
Shear Diagram: Equations 5.2, 5.4, and 5.6 involve the shear. Using
these equations, we can sketch V(x) progressively from x = 0 to x = L.
It is convenient to sketch the shear and moment diagrams directly below
the load diagram (Fig. 3a). Each step involved in sketching V(x) is
numbered in Fig. 3b.
1. The shear at x = 0 is zero.
2. The shear at x=0 is determined from Eq. 5.4, that is, AVA
Ay
m
(5)
Fig. 3 Shear and moment diagrams.
P(La)
L
=
Note that, because of the sign convention for shear,
an upward concentrated force causes an upward jump in the shear
diagram.
3. For 0<x<a, p(x) = 0. Therefore, from Eq. 5.2, dV/dx = 0.
4. Atx a there is a downward force P, so AVB = -P.
dV
5. For a<x<L, p(x) = 0, so-
= 0.
dx
Pa
6. The reaction at C causes AVC which closes the shear diagram
back to zero at x=L'.
Moment Diagram: Equations 5.3, 5.5, and 5.7 relate to M(x) and can be
used to sketch the moment diagram in Fig. 3c. Steps in the construction
of the moment diagram are explained and numbered.
1. The moment at x=0 is zero [simply supported beam].
dM
dx
2. For 0<x<a, Eq. 5.3 gives = V(x)=-
P(L-a)
L
= constant.
3. Atxa, M(a) can be determined from Eq. 5.7 as the area of the
rectangle under the shear curve from x = 0 to x = a. Therefore
maximum bending moment.
-0-|V(x)dx=
P(L-a),
=
L
(a). M(a)
=
Pa(L-a)
L
is the
dM
-Pa
4. For a<x<L, Eq. 5.3 gives -
dx
V(x)=
= constant.
5. Equation 5.7 gives M(L) M(a) =
- [V(x)d
Pa
V(x)dx
(L-a),
which closes the moment diagram back to zero at x = L, as it should
[simple support at C].
Review the Solution The dimensions on the shear diagram (F) and the
moment diagram (FL) are correct. If we draw finite free-body diagrams
of the ends of the beam, we get Fig. 4. Therefore, the shear diagram in Fig.
36 has the correct signs according to the free-body sketches in Fig. 4 and the
sign convention in Fig. 5.6. The downward force will bend the beam as
shown in Fig. 5, which is consistent with the fact that the bending moment
is positive everywhere. The maximum bending moment occurs at the cross
section where the force P is applied and where the shear force changes sign.
B
Shear
Fig. 4
Fig. 5
Shear
Use Eqs. 5.2 through 5.7 to sketch shear and moment diagrams for
simply supported beam shown in Fig. 1.
Plan the Solution We can use a free-body diagram of the beam AC in
Fig. 2 to determine the reactions at A and C. Since there is no distributed
load on the beam, p(x) = 0 everywhere. Because of the concentrated
couple at B, we need to consider two spans, 0 < x <a and a <x<L
Solution
Equilibrium-Reactions: We first determine the reactions A, and Cy.
-Mo
L
(1)
V(x)
A₂
Ma
Fig. 1
B
Fig. 2 A free-body diagram.
(2)
M(x)
(D)
(2)
(a) Load diagram.
(b) Shear diagram.
(3)
-My-)
L
(c) Moment diagram.
Мо
+C(μM)-
+C (ΣM)-
= 0:
-Mo - C,L=0→C, =
Mo
-0→A,
- 0:
A,L-Mo-
Shear Diagram: Equations 5.2, 5.4, and 5.6 involve the shear. Using
these equations and the load diagram in Fig. 3a, we can sketch V(x) pro-
gressively from x = 0 to x = L. It is convenient to sketch the shear and
moment diagrams directly below the load diagram. Each step involved in
sketching V(x) is numbered in Fig. 3b.
1. The shear at x=0" is zero.
2. The shear at x = 0 is determined from Eq. 5.4, that is, AV₁ =
A, M/L. Note that, because of the sign convention for shear,
an upward concentrated force causes an upward jump in the shear
diagram.
3. For 0<x<L.p(x) = 0. Therefore, from Eq. 5.2, dV/dx = 0, V(x)=
M/L = constant.
4. The reaction at C causes AVC --M/L, which closes the shear
diagram back to zero at x = L".
Moment Diagram: Equations 5.3, 5.5, and 5.7 relate to M(x) and can be
(4) used to sketch the moment diagram in Fig. 3c. Steps in the construction
of the moment diagram are explained and numbered.
1. The moment at x = 0 is zero (simply supported beam).
2. For <x<a, Eq. 5.3 gives dM/dx = V(x) = M/L = constant.
3. Atxa, M(a) can be determined from Eq. 5.7 as the area of the
rectangle under the shear curve from x = 0 to x = a. Therefore
M(a) -0- fgv(x)dx = M₁al L.
4. At xa there is a negative jump in moment given by Eq. 5.5. So
Moa
MoL-a)
L
L
M(a)=-
5.
Fig. 3 Load, shear, and moment
diagrams
6.
Mo=
For a<x<L, Eq. 5.3 gives dM/dx = V(x) = M/L = constant.
Equation 5.7 gives M(L) M(a) = V(x)dx = (M/L)(La),
which closes the moment diagram back to zero at x = L, as it should
[simple support at C].
Review the Solution The dimensions on the shear diagram (F) and the
moment diagram (F. L) are correct. Note that both the maximum
moment, Moall, and the minimum bending moment, -Mo(La)/L,
occur at the cross section where the concentrated couple acts. Compare
this example with the previous one, where there was a concentrated.
force.
Determine the reactions and sketch the shear and moment diagrams for
the beam shown in Fig. 1. (This beam is said to have an overhang BC.)
Show all significant values (that is, maxima, minima, positions of maxima
and minima, etc.) on the diagrams.
8 kN/m
16kN
Fig. 1
Plan the Solution We can use a free-body diagram of the whole beam
to compute the reactions. Then we can use Eqs. 5.2 through 5.7 to sketch
the V(x) and M(x) diagrams, as we did in Examples 5.7 and 5.8.
Solution
Equilibrium-Reactions: The reactions must be determined first. Figure 2
shows the appropriate free-body diagram.
18(4) 32 kN
-2m-l
16 KN
4m
2 m
Ay
By
Fig. 2 A free-body diagram.
+ C(ΣM)₁ = 0
0:
(8 kN/m)(4 m)(2 m) + (16 kN)(6 m) By(4 m) = 0
By=
=40 kN
+ C(ΣM)=
0:
-
A,(4 m) (8 kN/m)(4 m)(2 m) + (16 kN)(2m) = 0
A,
= 8 kN
Check: Is Fy=0?
8 3240 160? Yes
Ans.
Ans.
8 kN
V(KN)
(2)
(1)
(8)
8 kN/m
40 kN
(a) Load diagram
16kN
(6)
(5)
16
(7)
x(m)
It is convenient to sketch the V (Fig. 3b) and M (Fig. 3c) diagrams
directly below a sketch of the beam that has all of the loads and reactions
shown (Fig. 3a).
Shear Diagram: The following steps are used in sketching the shear
diagram (Fig. 3b).
1. V(0)=0 [no shear at end of beam].
2. V(0) 8 kN [Eq. 5.4].
3. dV/dx--8 kN/m [Eq. 5.2].
4. V(4) V(0) + (-8 kN/m)(4 m) -8-32-24 kN [Eq.5.6].
5. V(4) V(4) = 40 kN [Eq. 5.4].
6. dV/dx 0 [Eq. 5.2].
=
(3)
24H
7.
V(6) V(6)-16=0.
(b) Shear diagram.
8.
4
(1)
kNm)
-32H
(2
(3) & (4)
Im
(6)
(e) Moment diagram.
116
(8)
x(m)
Fig. 3 Shear and moment diagrams.
16kN
Shear
8 EN
Shear
ப
8 kN
རྒྱལ
(a)
Shear
16kN
AB
C
B
24 KN
40 kN
(b)
Fig. 4
Since dV/dx=-8 for 0 <x<4 m, and since V(0) = 8 kN, V = 0
at x = 1 m [Eq. 5.6].
Moment Diagram: The steps employed in constructing the moment dia-
gram (Fig. 3c) using Eqs. 5.2 through 5.7 will now be described:
1. M(0) = 0 [no moment at end of beam].
2. From dM/dx = V(x) we have the slope of M(x) going from +8
kN m/m at x=0 to zero at x = x=1 m. Therefore, the mo-
ment diagram for 0 < x <1 m must have the general shape.
[Eq.5.3].
3. M(x) is maximum where V(x) = 0 [Eq. 5.3].
4.
M(1) M(0)+5V(x)dx = (8 kN)(1 m) = 4 kN·m [Eq. 5.7; area
of triangle].
5. From x = 1 m to x 4 m, V(x) gets progressively more negative.
Therefore, M(x) must have the general shape [Eq.5.3].
6. M(4) M(0)+ V(x)dx=0+ (8 kN)(1 m)+(-24 kN)(3 m) =
-32 kN m (Eq. 5.7; net of areas of triangles]
7. dM/dx V(x)-16 kN [Eq.5.3].
8. M(6) M(4)+5V(x)dx = -32 kNm+ (16 kN)(2 m) = 0 [Eq.
5.7; no moment at end of beam].
The maximum shear occurs just to the left of the support at B and
has a magnitude of 24 kN. The maximum positive moment occurs where
V = 0 at x = 1 m and has a magnitude of 4 kN m; and the maximum
16kN negative moment occurs at the support B, and it has a magnitude of
32 kN·m.
(c)
Review the Solution By imagining cuts just to the right of A (Fig. 4a),
just to the left of B (Fig. 4b), and just to the right of B (Fig. 4c), we can
check the sign of the shear at these points.
The moment diagram is best checked by seeing if the sign of the
moment diagram corresponds to a reasonable deflected shape, that is,
concave upward where M(x) is positive and concave downward where
Deflection.
M positive
exaggerated
M negative
Fig. 5 A sketch showing the deflection of beam AC.
M(x) is negative, according to the sign convention that is given Fig. 5.6c.
Where M(x) = 0, the beam is locally straight, that is, it is neither concave
upward nor concave downward. We are able to sketch (Fig. 5) a plausi-
ble deflection curve that passes over the supports at A and B and that is
concave upward where M(x) is positive and concave downward where M
is negative. The distributed load between A and B and the concentrated
load at C could, indeed, cause the beam to deflect as sketched.
Mo
Fig. 1
B
Fig. 2 A free-body diagram.
(a) Load diagram.
Vix)
L
(2)
(1)
MIX)
(b) Shear diagram.
(1)
(2)
(3)
L
L
(c) Moment diagram.
load on the beam, p(x) = 0 everywhere. Because of the concentrated
couple at B, we need to consider two spans, 0<x<a and a<x<L.
Solution
Equilibrium-Reactions: We first determine the reactions A, and Cy.
- 0:
+C (ΣM)-
+C (ΣM)=
0:
-Mo
-Mo-CL-0→Cy
-
A,L. - Mo=0→A, M
Shear Diagram: Equations 5.2, 5.4, and 5.6 involve the shear. Using
these equations and the load diagram in Fig. 3a, we can sketch V(x) pro-
gressively from x = 0 to x-L. It is convenient to sketch the shear and
moment diagrams directly below the load diagram. Each step involved in
sketching V(x) is numbered in Fig. 3b.
1. The shear at x=0" is zero.
2. The shear at x=0 is determined from Eq. 5.4, that is, AV₁ =
A, M/L. Note that, because of the sign convention for shear,
an upward concentrated force causes an upward jump in the shear
diagram.
3. For 0<x<Lp(x) = 0. Therefore, from Eq. 5.2, dVidx = 0, V(x) =
ML constant.
4. The reaction at C causes AV-M/L, which closes the shear
diagram back to zero at x = L*.
Moment Diagram: Equations 5.3, 5.5, and 5.7 relate to M(x) and can be
(4) used to sketch the moment diagram in Fig. 3c. Steps in the construction.
of the moment diagram are explained and numbered.
(6)
1. The moment at x = 0 is zero (simply supported beam).
2. For 0<x<a, Eq. 5.3 gives dM/dx = V(x) = M/L = constant.
3. Atxa,M(a) can be determined from Eq. 5.7 as the area of the
rectangle under the shear curve from x = 0 to x = a." Therefore
M(a)-0fgV(x)dx = Moal L.
4. At x = a there is a negative jump in moment given by Eq.5.5. So
Moa
Mo(L-a)
L
L
M(a)=
5.
Fig. 3 Load, shear, and moment
diagrams.
6.
-
Mo=
For a <x<L, Eq. 5.3 gives dM/dx - V(x) - M/L - constant.
Equation 5.7 gives M(L) M(a) = f(x)dx = (M/L)(La),
which closes the moment diagram back to zero at x = L, as it should
[simple support at C].
Review the Solution The dimensions on the shear diagram (F) and the
moment diagram (F L) are correct. Note that both the maximum
moment, Moall, and the minimum bending moment, -Mo(La)/L,
occur at the cross section where the concentrated couple acts. Compare
this example with the previous one, where there was a concentrated
force.
dV
= p(x)
dx
dM
== V(x)
dx
AVA = Po
|AMB = MB
V2 V₁ =
x2
x1
p(x)dx
M₂-M₁ =
V(x) dx
M(x) M(x)
כו
C1
V(x)
V(x)
(a) Positive V and M on section "x."
+x face
+y face
M
M V
V
V
(b) Positive shear.
(c) Positive moment.
(d) Positive V and M.
12 kip.ft
A
4 kips
-4 ft-
6 kips
B
4 ft-
Equation
dV
= p(x) (Eq. 5.2)
dx
AV Po (Eq. 54)
Load
Diagram
Shear
Diagram
1. Slope of shear diagram equals value of load
Moment
Diagram
M
V₁
Slope P₁
2. Jump in shear equals value of concentrated load
M₁
V₁
Positive V-jump
V₂
M₂
V₂
M₂
3. Change in shear equals area under distributed-load diagram
V₁₂- V₁ =
LP(r)dx
p(x)dx (Eq. 5.6)
dM
dx
=V(x) (Eq.5.3)
(Area)
M
My
V₂-V₁ = (Area)
4. Slope of moment diagram equals value of shear
5. Jump in moment equals (value of concentrated couple)
Mo
6. Change in moment equals area under shear diagram
AM -Mo (Eq. 5.5)
MV
M₂-My-
[*V(x)dx
V(x)dx (Eq.5.7)
Slope - V₁
M
Negative M-jump
M₂
M₂
(Area)y
V₂
M₂-M₁ = (Area)
M₂
Fig. 1
Use Eqs. 5.2 through 5.7 to sketch shear and moment diagrams for the
simply-supported beam shown in Fig. 1.
Plan the Solution We can use a free-body diagram of the beam AC to
determine the reactions at A and C. Since there is no distributed load on
the beam, p(x) = 0 everywhere. Because of the concentrated load at B.
we need to consider two spans, 0 <x<a and a <x<L
Solution
Equilibrium-Reactions: To determine the reactions A, and C,, we first
draw the free-body diagram of the entire beam AC (Fig. 2).
B
Vix) PU-
L
B
L-a
(a) Load diagram.
(3)
(2)
(1)
(4)
-2 F
A
P
(5)
(b) Shear diagram.
M(x)
(3)
(4)
(2)
(1)
(c) Moment diagram.
(6)
+C(ΣM)-
- 0:
+C(ΣM)
- 0:
Ay
Fig. 2 A free-body diagram.
Pa-CyL = 0, Cy = P(+)
A,L-P(La) 0, Ay
P(L-a)
-
L
Shear Diagram: Equations 5.2, 5.4, and 5.6 involve the shear. Using
these equations, we can sketch V(x) progressively from x = 0 to x = L.
It is convenient to sketch the shear and moment diagrams directly below
the load diagram (Fig. 3a). Each step involved in sketching V(x) is
numbered in Fig. 3b.
1. The shear at x = 0 is zero.
2. The shear at x=0 is determined from Eq. 5.4, that is, AVA
Ay
m
(5)
Fig. 3 Shear and moment diagrams.
P(La)
L
=
Note that, because of the sign convention for shear,
an upward concentrated force causes an upward jump in the shear
diagram.
3. For 0<x<a, p(x) = 0. Therefore, from Eq. 5.2, dV/dx = 0.
4. Atx a there is a downward force P, so AVB = -P.
dV
5. For a <x<L, p(x) = 0, so-
= 0.
dx
Pa
6. The reaction at C causes AVC which closes the shear diagram
back to zero at x=L'.
Moment Diagram: Equations 5.3, 5.5, and 5.7 relate to M(x) and can be
used to sketch the moment diagram in Fig. 3c. Steps in the construction
of the moment diagram are explained and numbered.
1. The moment at x=0 is zero [simply supported beam].
dM
dx
2. For 0<x<a, Eq. 5.3 gives = V(x)=-
P(L-a)
L
= constant.
3. Atxa, M(a) can be determined from Eq. 5.7 as the area of the
rectangle under the shear curve from x = 0 to x = a. Therefore
maximum bending moment.
-0-|V(x)dx=
P(L-a),
=
L
(a). M(a)
=
Pa(L-a)
L
is the
dM
-Pa
4. For a<x<L, Eq. 5.3 gives -
V(x)=
= constant.
dx
5. Equation 5.7 gives M(L) M(a) =
- [V(x)d
Pa
V(x)dx
(L-a),
which closes the moment diagram back to zero at x = L, as it should
[simple support at C].
Review the Solution The dimensions on the shear diagram (F) and the
moment diagram (FL) are correct. If we draw finite free-body diagrams
of the ends of the beam, we get Fig. 4. Therefore, the shear diagram in Fig.
36 has the correct signs according to the free-body sketches in Fig. 4 and the
sign convention in Fig. 5.6. The downward force will bend the beam as
shown in Fig. 5, which is consistent with the fact that the bending moment
is positive everywhere. The maximum bending moment occurs at the cross
section where the force P is applied and where the shear force changes sign.
B
Shear
Fig. 4
Fig. 5
Shear
Use Eqs. 5.2 through 5.7 to sketch shear and moment diagrams for
simply supported beam shown in Fig. 1.
Plan the Solution We can use a free-body diagram of the beam AC in
Fig. 2 to determine the reactions at A and C. Since there is no distributed
load on the beam, p(x) = 0 everywhere. Because of the concentrated
couple at B, we need to consider two spans, 0 < x <a and a <x<L
Solution
Equilibrium-Reactions: We first determine the reactions A, and Cy.
-Mo
L
(1)
V(x)
A₂
Ma
Fig. 1
B
Fig. 2 A free-body diagram.
(2)
M(x)
(D)
(2)
(a) Load diagram.
(b) Shear diagram.
(3)
-My-)
L
Мо
+C(μM)-
+C (ΣM)-
= 0:
-Mo - C,L=0→C, =
Mo
-0→A,
- 0:
A,L-Mo-
Shear Diagram: Equations 5.2, 5.4, and 5.6 involve the shear. Using
these equations and the load diagram in Fig. 3a, we can sketch V(x) pro-
gressively from x = 0 to x = L. It is convenient to sketch the shear and
moment diagrams directly below the load diagram. Each step involved in
sketching V(x) is numbered in Fig. 3b.
1. The shear at x=0" is zero.
2. The shear at x = 0 is determined from Eq. 5.4, that is, AV₁ =
A, M/L. Note that, because of the sign convention for shear,
an upward concentrated force causes an upward jump in the shear
diagram.
3. For 0<x<L.p(x) = 0. Therefore, from Eq. 5.2, dV/dx = 0, V(x)=
M/L = constant.
4. The reaction at C causes AVC --M/L, which closes the shear
diagram back to zero at x = L".
Moment Diagram: Equations 5.3, 5.5, and 5.7 relate to M(x) and can be
(4) used to sketch the moment diagram in Fig. 3c. Steps in the construction
of the moment diagram are explained and numbered.
1. The moment at x = 0 is zero (simply supported beam).
2. For <x<a, Eq. 5.3 gives dM/dx = V(x) = M/L = constant.
3. Atxa, M(a) can be determined from Eq. 5.7 as the area of the
rectangle under the shear curve from x = 0 to x = a. Therefore
M(a) -0- fgv(x)dx = M₁al L.
4. At xa there is a negative jump in moment given by Eq. 5.5. So
Moa
MoL-a)
L
L
M(a)=-
(c) Moment diagram.
5.
Fig. 3 Load, shear, and moment
diagrams
6.
Mo=
For a<x<L, Eq. 5.3 gives dM/dx = V(x) = M/L = constant.
Equation 5.7 gives M(L) M(a) = V(x)dx = (M/L)(La),
which closes the moment diagram back to zero at x = L, as it should
[simple support at C].
Review the Solution The dimensions on the shear diagram (F) and the
moment diagram (F. L) are correct. Note that both the maximum
moment, Moall, and the minimum bending moment, -Mo(La)/L,
occur at the cross section where the concentrated couple acts. Compare
this example with the previous one, where there was a concentrated.
force.
Determine the reactions and sketch the shear and moment diagrams for
the beam shown in Fig. 1. (This beam is said to have an overhang BC.)
Show all significant values (that is, maxima, minima, positions of maxima
and minima, etc.) on the diagrams.
8 kN/m
16kN
Fig. 1
Plan the Solution We can use a free-body diagram of the whole beam
to compute the reactions. Then we can use Eqs. 5.2 through 5.7 to sketch
the V(x) and M(x) diagrams, as we did in Examples 5.7 and 5.8.
Solution
Equilibrium-Reactions: The reactions must be determined first. Figure 2
shows the appropriate free-body diagram.
18(4) 32 kN
-2m-l
16 KN
4m
2 m
Ay
By
Fig. 2 A free-body diagram.
+ C(ΣM)₁ = 0
0:
(8 kN/m)(4 m)(2 m) + (16 kN)(6 m) By(4 m) = 0
By=
=40 kN
+ C(ΣM)=
0:
-
A,(4 m) (8 kN/m)(4 m)(2 m) + (16 kN)(2m) = 0
A,
= 8 kN
Check: Is Fy=0?
8 3240 160? Yes
Ans.
Ans.
8 kN
V(KN)
(2)
(1)
(8)
8 kN/m
40 kN
(a) Load diagram
16kN
(6)
(5)
16
(7)
x(m)
It is convenient to sketch the V (Fig. 3b) and M (Fig. 3c) diagrams
directly below a sketch of the beam that has all of the loads and reactions
shown (Fig. 3a).
Shear Diagram: The following steps are used in sketching the shear
diagram (Fig. 3b).
1. V(0)=0 [no shear at end of beam].
2. V(0) 8 kN [Eq. 5.4].
3. dV/dx--8 kN/m [Eq. 5.2].
4. V(4) V(0) + (-8 kN/m)(4 m) -8-32-24 kN [Eq.5.6].
5. V(4) V(4) = 40 kN [Eq. 5.4].
6. dV/dx 0 [Eq. 5.2].
=
(3)
24H
7.
V(6) V(6)-16=0.
(b) Shear diagram.
8.
4
(1)
kNm)
-32H
(2
(3) & (4)
Im
(6)
(e) Moment diagram.
116
(8)
x(m)
Fig. 3 Shear and moment diagrams.
16kN
Shear
8 EN
Shear
ப
8 kN
རྒྱལ
(a)
Shear
16kN
AB
C
B
24 KN
40 kN
(b)
Fig. 4
Since dV/dx=-8 for 0 <x<4 m, and since V(0) = 8 kN, V = 0
at x = 1 m [Eq. 5.6].
Moment Diagram: The steps employed in constructing the moment dia-
gram (Fig. 3c) using Eqs. 5.2 through 5.7 will now be described:
1. M(0) = 0 [no moment at end of beam].
2. From dM/dx = V(x) we have the slope of M(x) going from +8
kN m/m at x=0 to zero at x = x=1 m. Therefore, the mo-
ment diagram for 0 < x <1 m must have the general shape.
[Eq.5.3].
3. M(x) is maximum where V(x) = 0 [Eq. 5.3].
4.
M(1) M(0)+5V(x)dx = (8 kN)(1 m) = 4 kN·m [Eq. 5.7; area
of triangle].
5. From x = 1 m to x 4 m, V(x) gets progressively more negative.
Therefore, M(x) must have the general shape [Eq.5.3].
6. M(4) M(0)+ V(x)dx=0+ (8 kN)(1 m)+(-24 kN)(3 m) =
-32 kN m (Eq. 5.7; net of areas of triangles]
7. dM/dx V(x)-16 kN [Eq.5.3].
8. M(6) M(4)+5V(x)dx = -32 kNm+ (16 kN)(2 m) = 0 [Eq.
5.7; no moment at end of beam].
The maximum shear occurs just to the left of the support at B and
has a magnitude of 24 kN. The maximum positive moment occurs where
V = 0 at x = 1 m and has a magnitude of 4 kN m; and the maximum
16kN negative moment occurs at the support B, and it has a magnitude of
32 kN·m.
(c)
Review the Solution By imagining cuts just to the right of A (Fig. 4a),
just to the left of B (Fig. 4b), and just to the right of B (Fig. 4c), we can
check the sign of the shear at these points.
The moment diagram is best checked by seeing if the sign of the
moment diagram corresponds to a reasonable deflected shape, that is,
concave upward where M(x) is positive and concave downward where
Deflection.
M positive
exaggerated
M negative
Fig. 5 A sketch showing the deflection of beam AC.
M(x) is negative, according to the sign convention that is given Fig. 5.6c.
Where M(x) = 0, the beam is locally straight, that is, it is neither concave
upward nor concave downward. We are able to sketch (Fig. 5) a plausi-
ble deflection curve that passes over the supports at A and B and that is
concave upward where M(x) is positive and concave downward where M
is negative. The distributed load between A and B and the concentrated
load at C could, indeed, cause the beam to deflect as sketched.
Mo
Fig. 1
B
Fig. 2 A free-body diagram.
(a) Load diagram.
Vix)
L
(2)
(1)
MIX)
(b) Shear diagram.
(1)
(2)
(3)
L
L
(c) Moment diagram.
load on the beam, p(x) = 0 everywhere. Because of the concentrated
couple at B, we need to consider two spans, 0<x<a and a<x<L.
Solution
Equilibrium-Reactions: We first determine the reactions A, and Cy.
- 0:
+C (ΣM)-
+C (ΣM)=
0:
-Mo
-Mo-CL-0→Cy
-
A,L. - Mo=0→A, M
Shear Diagram: Equations 5.2, 5.4, and 5.6 involve the shear. Using
these equations and the load diagram in Fig. 3a, we can sketch V(x) pro-
gressively from x = 0 to x-L. It is convenient to sketch the shear and
moment diagrams directly below the load diagram. Each step involved in
sketching V(x) is numbered in Fig. 3b.
1. The shear at x=0" is zero.
2. The shear at x=0 is determined from Eq. 5.4, that is, AV₁ =
A, M/L. Note that, because of the sign convention for shear,
an upward concentrated force causes an upward jump in the shear
diagram.
3. For 0<x<Lp(x) = 0. Therefore, from Eq. 5.2, dVidx = 0, V(x) =
ML constant.
4. The reaction at C causes AV-M/L, which closes the shear
diagram back to zero at x = L*.
Moment Diagram: Equations 5.3, 5.5, and 5.7 relate to M(x) and can be
(4) used to sketch the moment diagram in Fig. 3c. Steps in the construction.
of the moment diagram are explained and numbered.
(6)
1. The moment at x = 0 is zero (simply supported beam).
2. For 0<x<a, Eq. 5.3 gives dM/dx = V(x) = M/L = constant.
3. Atxa,M(a) can be determined from Eq. 5.7 as the area of the
rectangle under the shear curve from x = 0 to x = a." Therefore
M(a)-0fgV(x)dx = Moal L.
4. At x = a there is a negative jump in moment given by Eq.5.5. So
Moa
Mo(L-a)
L
L
M(a)=
5.
Fig. 3 Load, shear, and moment
diagrams.
6.
-
Mo=
For a <x<L, Eq. 5.3 gives dM/dx - V(x) - M/L - constant.
Equation 5.7 gives M(L) M(a) = f(x)dx = (M/L)(La),
which closes the moment diagram back to zero at x = L, as it should
[simple support at C].
Review the Solution The dimensions on the shear diagram (F) and the
moment diagram (F L) are correct. Note that both the maximum
moment, Moall, and the minimum bending moment, -Mo(La)/L,
occur at the cross section where the concentrated couple acts. Compare
this example with the previous one, where there was a concentrated
force.
dV
= p(x)
dx
dM
== V(x)
dx
AVA = Po
|AMB = MB
V2 V₁ =
x2
x1
p(x)dx
M₂-M₁ =
V(x) dx
3 kips/ft-
6 ft.
3 ft-
check_circle الجواب — حل مفصل خطوة بخطوة
hourglass_top
🔒
الحل الكامل متاح للمشتركين
اشترك في أرشيف الأسئلة لعرض هذا الحل وآلاف الحلول المفصلة خطوة بخطوة من معلمين معتمدين.