تم الحل ✓
categoryالفيزياء
schoolبكالوريوس
event_available2026-07-15
السؤال
Transcribed Image Text:
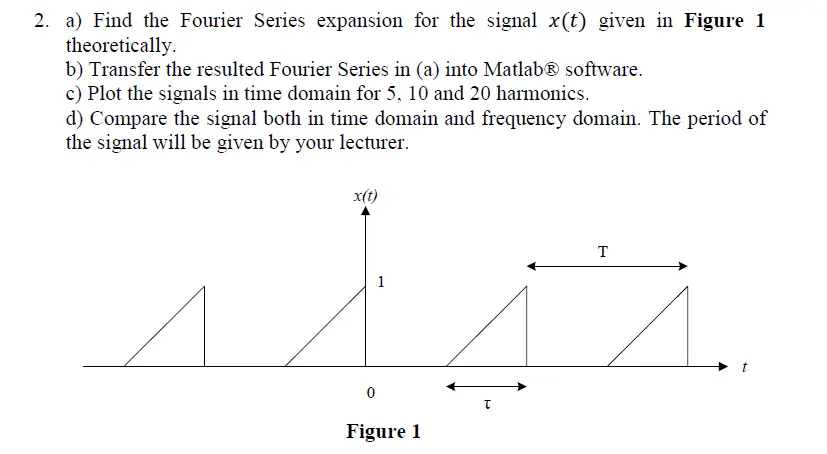
2. a) Find the Fourier Series expansion for the signal x(t) given in Figure 1
theoretically.
b) Transfer the resulted Fourier Series in (a) into MatlabⓇ software.
c) Plot the signals in time domain for 5, 10 and 20 harmonics.
d) Compare the signal both in time domain and frequency domain. The period of
the signal will be given by your lecturer.
x(t)
1
0
Figure 1
τ
T
3. Construct a low-pass filter as in Figure 2(a) (using MatlabⓇ) with frequency
response characteristics given in Figure 2(b).
gain 0.7
C
Vo
0.5
(-a)RC low Pass Filter Circuit
(b) Frequency ResponseCurve
Figure 2: A simple low pass filter (first order) circuit.
In your report, show that the impulse response for the first order low-pass filter in
Figure 1 is given by
1
H(f) = 1 + jamfRC
The cut-off frequency for the low pass filter is
1
fcutoff=
2 RC
1
The cutoff frequency for each group is 5 times the frequency of your signal in Task
2. Example if your group frequency is 200 kHz, then the cut off for your filter is
1000 kHz.
4. The signal in Task 2 is passed through the low-pass filter you built in Task 3.
Analyze the output of the filter both in time domain and frequency domain.
check_circle الجواب — حل مفصل خطوة بخطوة
hourglass_top
🔒
الحل الكامل متاح للمشتركين
اشترك في أرشيف الأسئلة لعرض هذا الحل وآلاف الحلول المفصلة خطوة بخطوة من معلمين معتمدين.