تم الحل ✓
categoryإحصاء
schoolبكالوريوس
event_available2026-07-15
السؤال
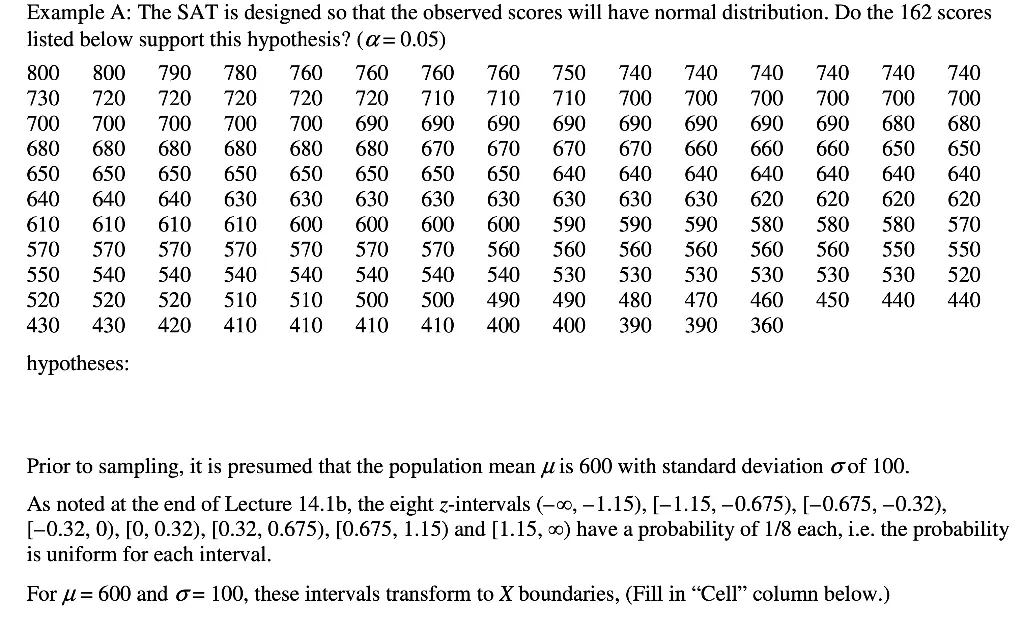
Transcribed Image Text:
Example A: The SAT is designed so that the observed scores will have normal distribution. Do the 162 scores
listed below support this hypothesis? (α = 0.05)
800 800 790
780
760 760
760
760 750 740 740
740
740 740 740
730 720 720
720 720
720
710 710 710
700 700
700
700 700 700
700
700
700
700
700
690
690
690
690
690
690
690
690
680 680
680 680
680
680
680
680
670
670
670
670
660 660
660
650 650
650
650
650
650
650
650
650
650
640
640
640
640
640
640 640
640 640
640
630
630
630
630
630 630
630 630
620
620
620 620
610 610
610 610
600
600
600
600 590
590 590
580
580
580 570
570 570 570
570
570
570
570
560 560
560
560
560 560
550
550
550 540 540 540
540
540
540
540
530
530
530
530
530 530 520
520 520 520
510
510
500
500
490
490
480
470
460
450 440
440
430 430 420 410 410
410
410
400
400 390
390
360
hypotheses:
Prior to sampling, it is presumed that the population mean μ is 600 with standard deviation of 100.
As noted at the end of Lecture 14.1b, the eight z-intervals (-0, -1.15), [-1.15, -0.675), [-0.675, -0.32),
[-0.32,0), [0, 0.32), [0.32, 0.675), [0.675, 1.15) and [1.15, ∞) have a probability of 1/8 each, i.e. the probability
is uniform for each interval.
For μ=600 and σ= 100, these intervals transform to X boundaries, (Fill in "Cell" column below.)
Prior to sampling, it is presumed that the population mean μ is 600 with standard deviation σ of 100.
As noted at the end of Lecture 14.1b, the eight z-intervals (-00, -1.15), [-1.15, -0.675), [-0.675, -0.32),
[-0.32, 0), [0, 0.32), [0.32, 0.675), [0.675, 1.15) and [1.15, 0) have a probability of 1/8 each, i.e. the probability
is uniform for each interval.
For u 600 and σ= 100, these intervals transform to X boundaries, (Fill in "Cell" column below.)
The observed counts are ... (Fill in "Observed" column below.)
Next step: We need to transform these X boundaries into estimated (expected) cell probabilities, л, (a,ô), using
the maximum likelihood estimates û and . Back in Lecture 6.2, we derived formulas for both of these.
Cell
Observed
n₁
Estimated
Expected
=ηπ (0,6)
(0-E)² (n;
(O-E)
(0-E)²
E
‚¯në₁(û‚ô))²
nл (Û‚ô)
x² = Σ (0-E)²
E
IMPORTANT: The symbol x² is a notation! Do not square the sum in the last column.
critical values:
conclusion:
check_circle الجواب — حل مفصل خطوة بخطوة
hourglass_top
🔒
الحل الكامل متاح للمشتركين
اشترك في أرشيف الأسئلة لعرض هذا الحل وآلاف الحلول المفصلة خطوة بخطوة من معلمين معتمدين.