تم الحل ✓
categoryالهندسة الكهربائية
schoolبكالوريوس
event_available2026-07-15
السؤال
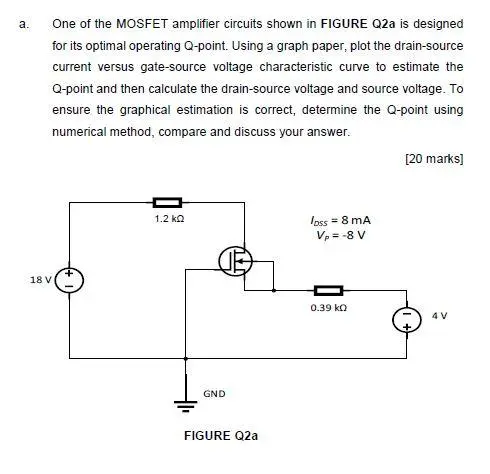
Transcribed Image Text:
a.
One of the MOSFET amplifier circuits shown in FIGURE Q2a is designed
for its optimal operating Q-point. Using a graph paper, plot the drain-source
current versus gate-source voltage characteristic curve to estimate the
Q-point and then calculate the drain-source voltage and source voltage. To
ensure the graphical estimation is correct, determine the Q-point using
numerical method, compare and discuss your answer.
18 VI
1.2 ΚΩ
GND
FIGURE Q2a
IDSS 8 MA
Vp=-8 V
0.39 kQ
[20 marks]
4 V
check_circle الجواب — حل مفصل خطوة بخطوة
hourglass_top
🔒
الحل الكامل متاح للمشتركين
اشترك في أرشيف الأسئلة لعرض هذا الحل وآلاف الحلول المفصلة خطوة بخطوة من معلمين معتمدين.