تم الحل ✓
categoryإدارة البيئة
schoolبكالوريوس
event_available2026-07-15
السؤال
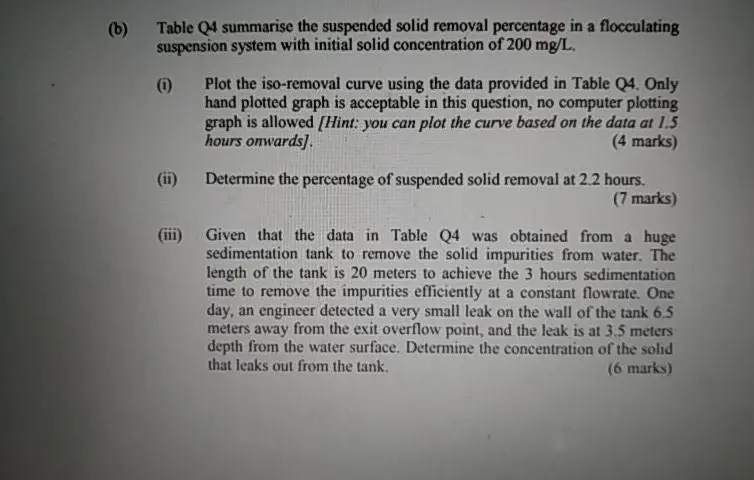
Transcribed Image Text:
(b)
Table Q4 summarise the suspended solid removal percentage in a flocculating
suspension system with initial solid concentration of 200 mg/L.
(0) Plot the iso-removal curve using the data provided in Table Q4. Only
hand plotted graph is acceptable in this question, no computer plotting
graph is allowed [Hint: you can plot the curve based on the data at 1.5
hours onwards].
(ii)
(4 marks)
Determine the percentage of suspended solid removal at 2.2 hours.
(7 marks)
(iii)
Given that the data in Table Q4 was obtained from a huge
sedimentation tank to remove the solid impurities from water. The
length of the tank is 20 meters to achieve the 3 hours sedimentation
time to remove the impurities efficiently at a constant flowrate. One
day, an engineer detected a very small leak on the wall of the tank 6.5
meters away from the exit overflow point, and the leak is at 3.5 meters
depth from the water surface. Determine the concentration of the solid
that leaks out from the tank.
(6 marks)
Table Q4: Percentage of suspended solid removal for the system.
Depth
(m)
Time of sampling (h)
0.5
1.0
1.5
2.0
2.5
3.0
1
47
67
80
85
88
91
2
28
50
63
74
78
83
3
19
40
53
63
72
77
4
15
33
46
56
64
72
5
12
28
42
51
59
68
6
10
25
38
47
55
62
[Total: 25 marks]
check_circle الجواب — حل مفصل خطوة بخطوة
hourglass_top
🔒
الحل الكامل متاح للمشتركين
اشترك في أرشيف الأسئلة لعرض هذا الحل وآلاف الحلول المفصلة خطوة بخطوة من معلمين معتمدين.