تم الحل ✓
categoryإحصاء
schoolبكالوريوس
event_available2026-07-15
السؤال
Transcribed Image Text:
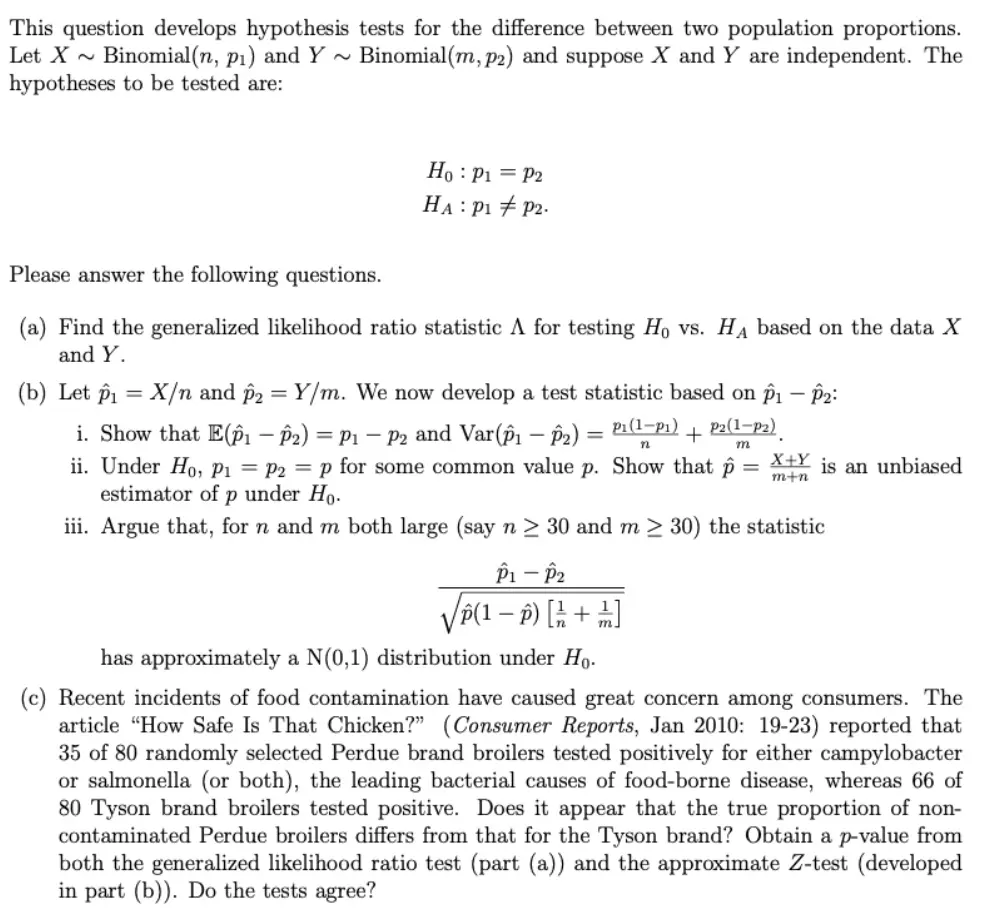
This question develops hypothesis tests for the difference between two population proportions.
Let X ~ Binomial(n, p₁) and Y ~ Binomial(m, p2) and suppose X and Y are independent. The
hypotheses to be tested are:
Ho P1 P2
HA: P1 P2.
Please answer the following questions.
(a) Find the generalized likelihood ratio statistic A for testing Ho vs. HA based on the data X
and Y.
==
(b) Let X/n and p2 = Y/m. We now develop a test statistic based on p₁ - 2:
P2(1-P2)
m
i. Show that E(p1-2) = P1 - P2 and Var(1-2) = P₁(1-p₁) +
n
ii. Under Ho, P₁ = P2 = p for some common value p. Show that :
estimator of p under Ho.
=
X+Y is an unbiased
m+n
iii. Argue that, for n and m both large (say n ≥ 30 and m≥ 30) the statistic
Ĥ1-Ĥ2
√√ô(1 − p) [½ + ½]
has approximately a N(0,1) distribution under Ho.
(c) Recent incidents of food contamination have caused great concern among consumers. The
article "How Safe Is That Chicken?" (Consumer Reports, Jan 2010: 19-23) reported that
35 of 80 randomly selected Perdue brand broilers tested positively for either campylobacter
or salmonella (or both), the leading bacterial causes of food-borne disease, whereas 66 of
80 Tyson brand broilers tested positive. Does it appear that the true proportion of non-
contaminated Perdue broilers differs from that for the Tyson brand? Obtain a p-value from
both the generalized likelihood ratio test (part (a)) and the approximate Z-test (developed
in part (b)). Do the tests agree?
check_circle الجواب — حل مفصل خطوة بخطوة
hourglass_top
🔒
الحل الكامل متاح للمشتركين
اشترك في أرشيف الأسئلة لعرض هذا الحل وآلاف الحلول المفصلة خطوة بخطوة من معلمين معتمدين.