تم الحل ✓
categoryالفيزياء
schoolبكالوريوس
event_available2026-07-15
السؤال
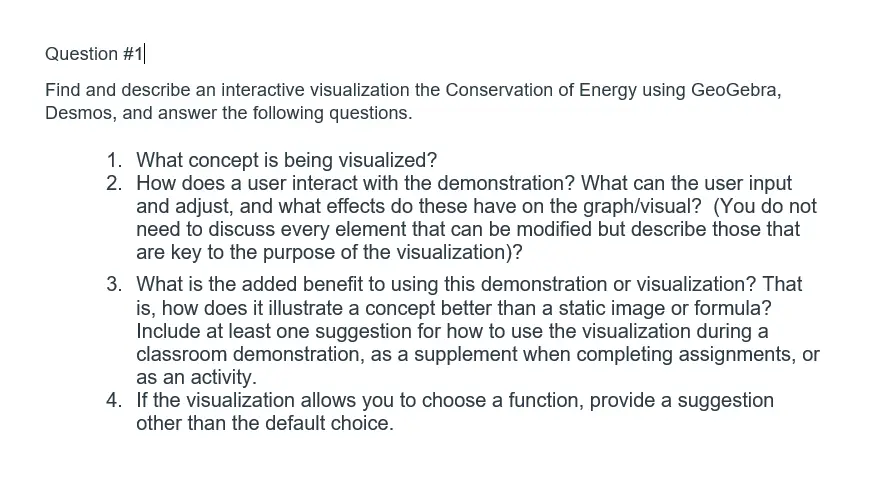
Transcribed Image Text:
Question #1|
Find and describe an interactive visualization the Conservation of Energy using GeoGebra,
Desmos, and answer the following questions.
1. What concept is being visualized?
2. How does a user interact with the demonstration? What can the user input
and adjust, and what effects do these have on the graph/visual? (You do not
need to discuss every element that can be modified but describe those that
are key to the purpose of the visualization)?
3. What is the added benefit to using this demonstration or visualization? That
is, how does it illustrate a concept better than a static image or formula?
Include at least one suggestion for how to use the visualization during a
classroom demonstration, as a supplement when completing assignments, or
as an activity.
4. If the visualization allows you to choose a function, provide a suggestion
other than the default choice.
check_circle الجواب — حل مفصل خطوة بخطوة
hourglass_top
🔒
الحل الكامل متاح للمشتركين
اشترك في أرشيف الأسئلة لعرض هذا الحل وآلاف الحلول المفصلة خطوة بخطوة من معلمين معتمدين.