تم الحل ✓
categoryعلوم الحاسوب
schoolبكالوريوس
event_available2026-07-15
السؤال
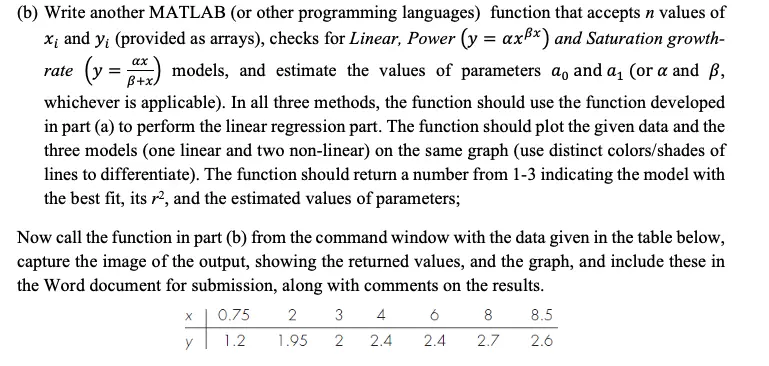
Transcribed Image Text:
(b) Write another MATLAB (or other programming languages) function that accepts n values of
x; and y; (provided as arrays), checks for Linear, Power (y = axẞ*) and Saturation growth-
αχ
(y = (xx) models, and estimate the values of parameters a₁ and α₁ (or α and ß,
whichever is applicable). In all three methods, the function should use the function developed
in part (a) to perform the linear regression part. The function should plot the given data and the
three models (one linear and two non-linear) on the same graph (use distinct colors/shades of
lines to differentiate). The function should return a number from 1-3 indicating the model with
the best fit, its 2, and the estimated values of parameters;
Now call the function in part (b) from the command window with the data given in the table below,
capture the image of the output, showing the returned values, and the graph, and include these in
the Word document for submission, along with comments on the results.
0.75
2
3
4
6
8
8.5
1.2 1.95
2
2.4
2.4
2.7
2.6
check_circle الجواب — حل مفصل خطوة بخطوة
hourglass_top
🔒
الحل الكامل متاح للمشتركين
اشترك في أرشيف الأسئلة لعرض هذا الحل وآلاف الحلول المفصلة خطوة بخطوة من معلمين معتمدين.