تم الحل ✓
categoryإحصاء
schoolبكالوريوس
event_available2026-07-15
السؤال
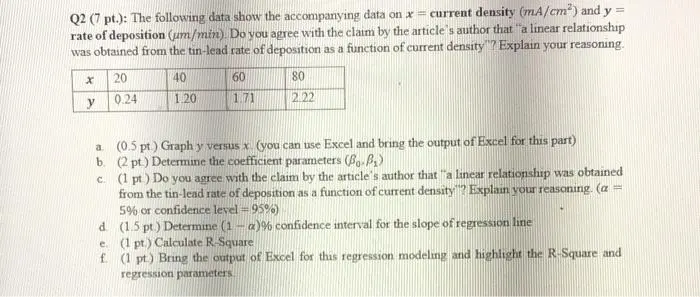
Transcribed Image Text:
Q2 (7 pt.): The following data show the accompanying data on x = current density (mA/cm²) and y =
rate of deposition (um/min) Do you agree with the claim by the article's author that "a linear relationship
was obtained from the tin-lead rate of deposition as a function of current density"? Explain your reasoning.
x
20
40
60
80
y
0.24
1.20
1.71
2.22
a
b.
(0.5 pt.) Graph y versus x (you can use Excel and bring the output of Excel for this part)
(2 pt.) Determine the coefficient parameters (Bo-P₁)
c. (1 pt.) Do you agree with the claim by the article's author that "a linear relationship was obtained
from the tin-lead rate of deposition as a function of current density? Explain your reasoning. (a =
5% or confidence level =95%)
d
(1.5 pt.) Determine (1-a)% confidence interval for the slope of regression line
e.
(1 pt.) Calculate R-Square
f
(1 pt.) Bring the output of Excel for this regression modeling and highlight the R-Square and
regression parameters.
check_circle الجواب — حل مفصل خطوة بخطوة
hourglass_top
🔒
الحل الكامل متاح للمشتركين
اشترك في أرشيف الأسئلة لعرض هذا الحل وآلاف الحلول المفصلة خطوة بخطوة من معلمين معتمدين.