تم الحل ✓
categoryالرياضيات
schoolبكالوريوس
event_available2026-07-15
السؤال
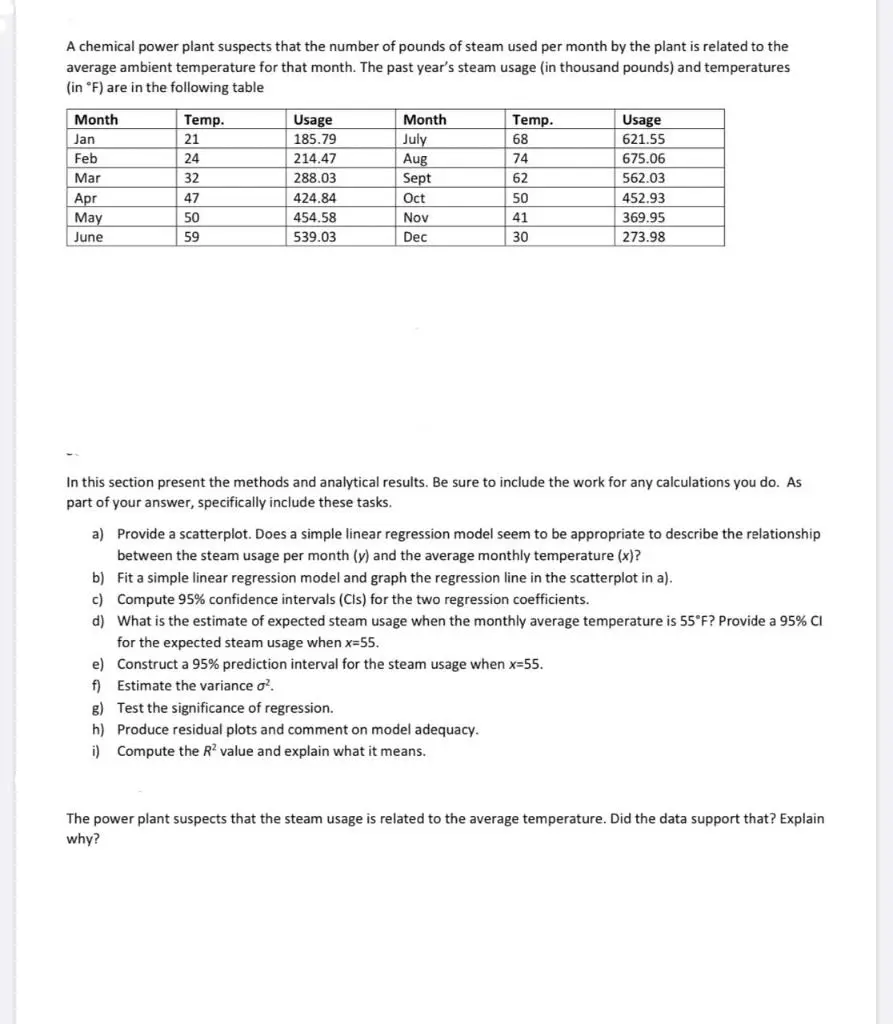
Transcribed Image Text:
A chemical power plant suspects that the number of pounds of steam used per month by the plant is related to the
average ambient temperature for that month. The past year's steam usage (in thousand pounds) and temperatures
(in °F) are in the following table
Month
Temp.
Usage
Month
Temp.
Usage
Jan
21
185.79
July
68
621.55
Feb
24
214.47
Aug
74
675.06
Mar
32
288.03
Sept
62
562.03
Apr
47
424.84
Oct
50
452.93
May
50
454.58
Nov
41
369.95
June
59
539.03
Dec
30
273.98
In this section present the methods and analytical results. Be sure to include the work for any calculations you do. As
part of your answer, specifically include these tasks.
a) Provide a scatterplot. Does a simple linear regression model seem to be appropriate to describe the relationship
between the steam usage per month (y) and the average monthly temperature (x)?
b) Fit a simple linear regression model and graph the regression line in the scatterplot in a).
c) Compute 95% confidence intervals (CIs) for the two regression coefficients.
d) What is the estimate of expected steam usage when the monthly average temperature is 55°F? Provide a 95% CI
for the expected steam usage when x=55.
e) Construct a 95% prediction interval for the steam usage when x=55.
f) Estimate the variance σ².
g) Test the significance of regression.
h) Produce residual plots and comment on model adequacy.
i) Compute the R² value and explain what it means.
The power plant suspects that the steam usage is related to the average temperature. Did the data support that? Explain
why?
check_circle الجواب — حل مفصل خطوة بخطوة
hourglass_top
🔒
الحل الكامل متاح للمشتركين
اشترك في أرشيف الأسئلة لعرض هذا الحل وآلاف الحلول المفصلة خطوة بخطوة من معلمين معتمدين.