تم الحل ✓
categoryطب وبائيات وصحة عامة
schoolبكالوريوس
event_available2026-07-15
السؤال
Transcribed Image Text:
EXAMPLE 2:
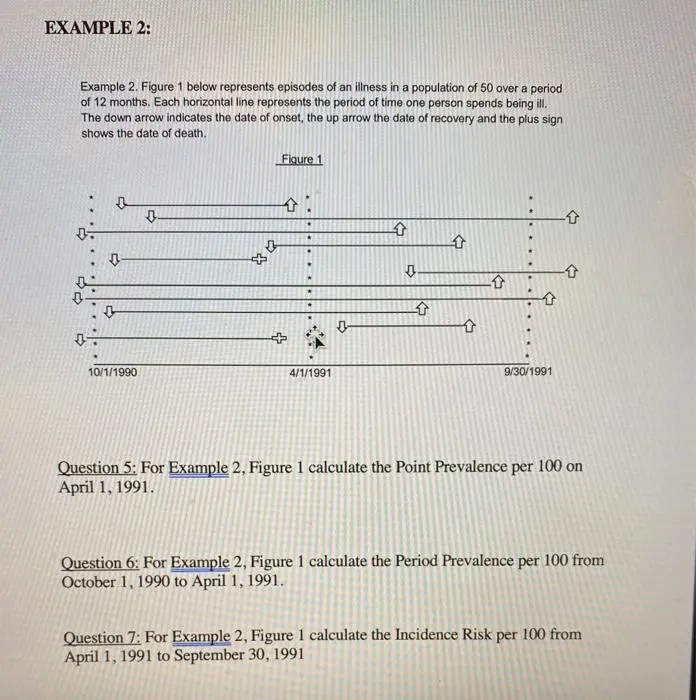
Example 2. Figure 1 below represents episodes of an illness in a population of 50 over a period
O
of 12 months. Each horizontal line represents the period of time one person spends being ill.
The down arrow indicates the date of onset, the up arrow the date of recovery and the plus sign
shows the date of death.
Figure 1
+
0
、
10/1/1990
+
0
.
⇧
。
⇧
.
⇧
合
4/1/1991
9/30/1991
Question 5: For Example 2, Figure 1 calculate the Point Prevalence per 100 on
April 1, 1991.
Question 6: For Example 2, Figure 1 calculate the Period Prevalence per 100 from
October 1, 1990 to April 1, 1991.
Question 7: For Example 2, Figure 1 calculate the Incidence Risk per 100 from
April 1, 1991 to September 30, 1991
check_circle الجواب — حل مفصل خطوة بخطوة
hourglass_top
🔒
الحل الكامل متاح للمشتركين
اشترك في أرشيف الأسئلة لعرض هذا الحل وآلاف الحلول المفصلة خطوة بخطوة من معلمين معتمدين.