تم الحل ✓
categoryإحصاء
schoolبكالوريوس
event_available2026-07-15
السؤال
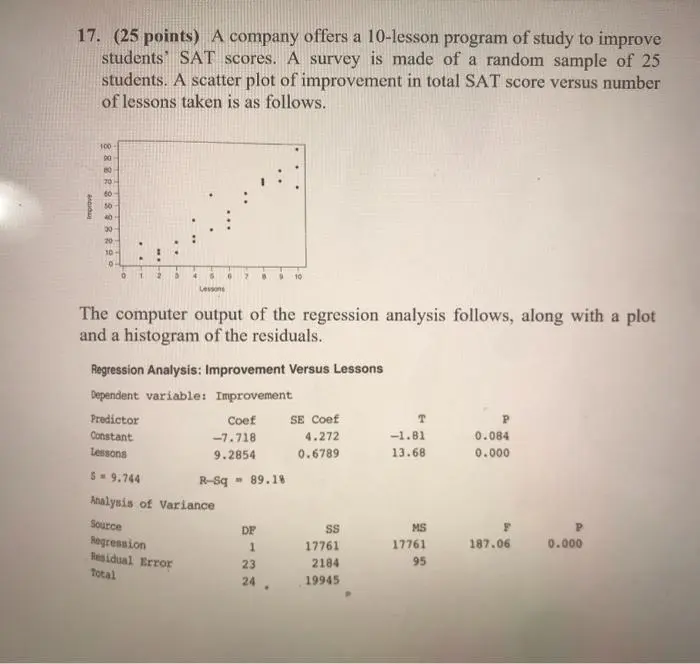
Transcribed Image Text:
17. (25 points) A company offers a 10-lesson program of study to improve
students SAT scores. A survey is made of a random sample of 25
students. A scatter plot of improvement in total SAT score versus number
of lessons taken is as follows.
Improve
100
90
80
70
60
50
40
30
20
10
° T 2
4
Lessons
10
The computer output of the regression analysis follows, along with a plot
and a histogram of the residuals.
Regression Analysis: Improvement Versus Lessons
Dependent variable: Improvement
Predictor
Constant
Lessons
S=9.744
Coef
-7.718
SE Coef
T
P
4.272
-1.81
0.084
9.2854
0.6789
13.68
0.000
R-Sq
-89.18
Analysis of Variance
MS
Source
DF
17761
187.06
0.000
Regression
1
Residual Error
23
Total
24.
17761
2184
19945
95
Residual
-10-
10-
Residuals Versus Lessons
(response is Improve)
1
2
3
4
Lessons
10
Frequency
Histogram of the Residuals
(response is improve)
(a) (5 points) What is the equation of the regression line that predicts
score improvement as a function of number of lessons?
Residual
(b) (5 points) Interpret, in context, the slope of the regression line
(i.e., coef 9.2854)
(c) (5 points) What is the meaning of the R-Sq in the context of this
study?
8-
(d) (3 points) Calculate the value of the correlation coefficient
(e) (7 points) Perform a test of significance for the slope of the
regression line. Should you accept or reject Ho and why?
check_circle الجواب — حل مفصل خطوة بخطوة
hourglass_top
🔒
الحل الكامل متاح للمشتركين
اشترك في أرشيف الأسئلة لعرض هذا الحل وآلاف الحلول المفصلة خطوة بخطوة من معلمين معتمدين.