تم الحل ✓
categoryرياضيات
schoolبكالوريوس
event_available2026-07-15
السؤال
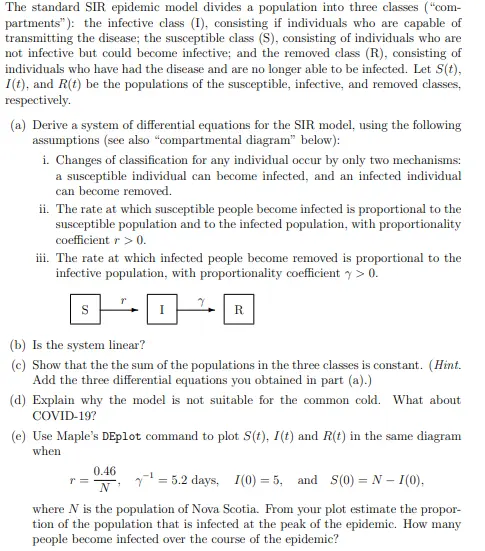
Transcribed Image Text:
The standard SIR epidemic model divides a population into three classes ("com-
partments"): the infective class (I), consisting if individuals who are capable of
transmitting the disease; the susceptible class (S), consisting of individuals who are
not infective but could become infective; and the removed class (R), consisting of
individuals who have had the disease and are no longer able to be infected. Let S(t),
I(t), and R(t) be the populations of the susceptible, infective, and removed classes,
respectively.
(a) Derive a system of differential equations for the SIR model, using the following
assumptions (see also "compartmental diagram" below):
i. Changes of classification for any individual occur by only two mechanisms:
a susceptible individual can become infected, and an infected individual
can become removed.
ii. The rate at which susceptible people become infected is proportional to the
susceptible population and to the infected population, with proportionality
coefficient r > 0.
iii. The rate at which infected people become removed is proportional to the
infective population, with proportionality coefficient > 0.
S
(b) Is the system linear?
R
(c) Show that the the sum of the populations in the three classes is constant. (Hint.
Add the three differential equations you obtained in part (a).)
(d) Explain why the model is not suitable for the common cold. What about
COVID-19?
(e) Use Maple's DEplot command to plot S(t), I(t) and R(t) in the same diagram
when
r =
0.46
N
= 5.2 days, I(0)=5, and S(0) = N - I(0),
where N is the population of Nova Scotia. From your plot estimate the p
propor-
tion of the population that is infected at the peak of the epidemic. How many
people become infected over the course of the epidemic?
check_circle الجواب — حل مفصل خطوة بخطوة
hourglass_top
🔒
الحل الكامل متاح للمشتركين
اشترك في أرشيف الأسئلة لعرض هذا الحل وآلاف الحلول المفصلة خطوة بخطوة من معلمين معتمدين.