تم الحل ✓
categoryالهندسة الكهربائية
schoolبكالوريوس
event_available2026-07-15
السؤال
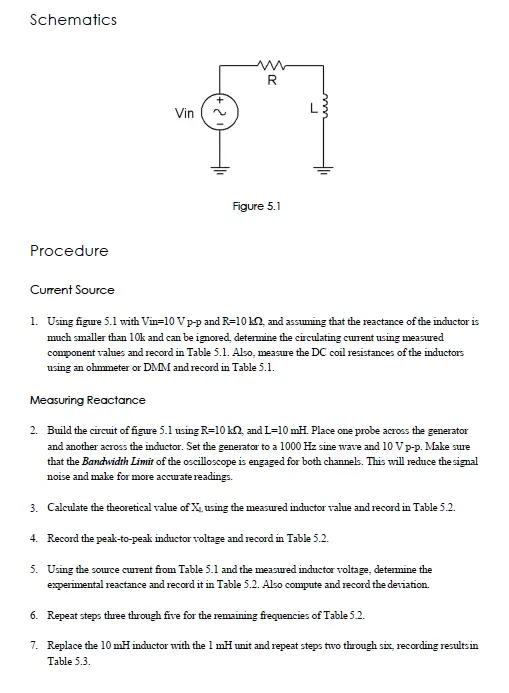
Transcribed Image Text:
Schematics
Vin
R
Figure 5.1
Procedure
Current Source
1. Using figure 5.1 with Vin-10 Vp-p and R-10 kn, and assuming that the reactance of the inductor is
much smaller than 10k and can be ignored, determine the circulating current using measured
component values and record in Table 5.1. Also, measure the DC coil resistances of the inductors
using an ohmmeter or DMM and record in Table 5.1.
Measuring Reactance
2. Build the circuit of figure 5.1 using R-10 k2, and L=10 mH. Place one probe across the generator
and another across the inductor. Set the generator to a 1000 Hz sine wave and 10 Vp-p. Make sure
that the Bandwidth Limit of the oscilloscope is engaged for both channels. This will reduce the signal
noise and make for more accurate readings.
3. Calculate the theoretical value of X, using the measured inductor value and record in Table 5.2.
4. Record the peak-to-peak inductor voltage and record in Table 5.2.
5. Using the source curent from Table 5.1 and the measured inductor voltage, determine the
experimental reactance and record it in Table 5.2. Also compute and record the deviation.
6. Repeat steps three through five for the remaining frequencies of Table 5.2.
7. Replace the 10 mH inductor with the 1 mH unit and repeat steps two through six, recording results in
Table 5.3.
Schematics
Vin
R
Figure 5.1
Procedure
Current Source
1. Using figure 5.1 with Vin-10 Vp-p and R-10 kn, and assuming that the reactance of the inductor is
much smaller than 10k and can be ignored, determine the circulating current using measured
component values and record in Table 5.1. Also, measure the DC coil resistances of the inductors
using an ohmmeter or DMM and record in Table 5.1.
Measuring Reactance
2. Build the circuit of figure 5.1 using R-10 k2, and L=10 mH. Place one probe across the generator
and another across the inductor. Set the generator to a 1000 Hz sine wave and 10 Vp-p. Make sure
that the Bandwidth Limit of the oscilloscope is engaged for both channels. This will reduce the signal
noise and make for more accurate readings.
3. Calculate the theoretical value of X, using the measured inductor value and record in Table 5.2.
4. Record the peak-to-peak inductor voltage and record in Table 5.2.
5. Using the source curent from Table 5.1 and the measured inductor voltage, determine the
experimental reactance and record it in Table 5.2. Also compute and record the deviation.
6. Repeat steps three through five for the remaining frequencies of Table 5.2.
7. Replace the 10 mH inductor with the 1 mH unit and repeat steps two through six, recording results in
Table 5.3.
8. Using the data of Tables 5.2 and 5.3, create plots of inductive reactance versus frequency.
Data Tables
İsource(p-p)
Rool of 10 mH
Rool of 1 mH
Table 5.1
Frequency
X₁ Theory
VLp-p) Exp
X₁ Exp
% Dev
1 k
2k
3 k
4k
5k
6k
8 k
10 k
Table 5.2
Frequency Xi Theory
VL(p-p) Exp
XL Exp
% Dev
10 k
20 k
30 k
40 k
50 k
60 k
80 k
100 k
Table 5.3
Questions
1. What is the relationship between inductive reactance and frequency?
2. What is the relationship between inductive reactance and inductance?
3. If the 10 mH trial had been repeated with frequencies 10 times higher than those in Table 5.2, what
effect would that have on the experiment?
4. Do the coil resistances have any effect on the plot
check_circle الجواب — حل مفصل خطوة بخطوة
hourglass_top
🔒
الحل الكامل متاح للمشتركين
اشترك في أرشيف الأسئلة لعرض هذا الحل وآلاف الحلول المفصلة خطوة بخطوة من معلمين معتمدين.