تم الحل ✓
categoryهندسة صناعية وإنتاج
schoolبكالوريوس
event_available2026-07-15
السؤال
Transcribed Image Text:
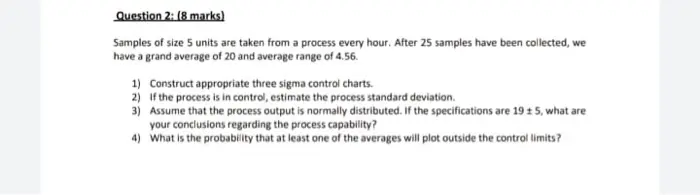
Question 2: (8 marks)
Samples of size 5 units are taken from a process every hour. After 25 samples have been collected, we
have a grand average of 20 and average range of 4.56.
1) Construct appropriate three sigma control charts.
2) If the process is in control, estimate the process standard deviation.
3) Assume that the process output is normally distributed. If the specifications are 19 ± 5, what are
your conclusions regarding the process capability?
4) What is the probability that at least one of the averages will plot outside the control limits?
check_circle الجواب — حل مفصل خطوة بخطوة
hourglass_top
🔒
الحل الكامل متاح للمشتركين
اشترك في أرشيف الأسئلة لعرض هذا الحل وآلاف الحلول المفصلة خطوة بخطوة من معلمين معتمدين.