تم الحل ✓
categoryإحصاء
schoolبكالوريوس
event_available2026-07-15
السؤال
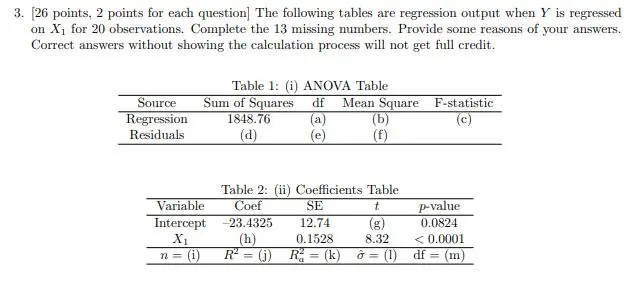
Transcribed Image Text:
3. [26 points, 2 points for each question] The following tables are regression output when Y is regressed
on X₁ for 20 observations. Complete the 13 missing numbers. Provide some reasons of your answers.
Correct answers without showing the calculation process will not get full credit.
Table 1: (i) ANOVA Table
df Mean Square F-statistic
Source
Sum of Squares
Regression
1848.76
(a)
(b)
Residuals
(d)
(e)
(f)
Table 2: (ii) Coefficients Table
Variable
Coef
SE
t
p-value
Intercept -23.4325
12.74
(g)
X₁
n =
(i)
(h)
R² =
0.1528
8.32
0.0824
< 0.0001
(j) R
(k) =
(1)
df = (m)
check_circle الجواب — حل مفصل خطوة بخطوة
hourglass_top
🔒
الحل الكامل متاح للمشتركين
اشترك في أرشيف الأسئلة لعرض هذا الحل وآلاف الحلول المفصلة خطوة بخطوة من معلمين معتمدين.