تم الحل ✓
categoryالهندسة الكهربائية
schoolبكالوريوس
event_available2026-07-15
السؤال
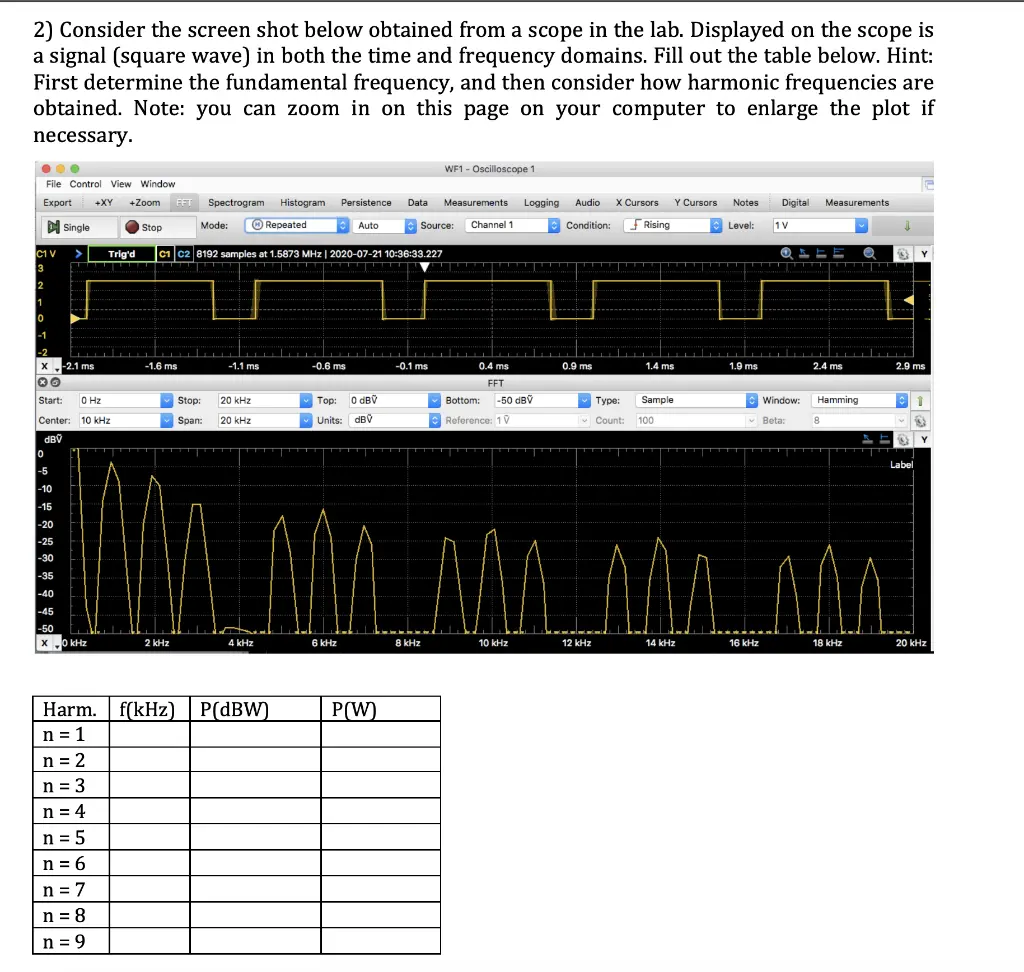
Transcribed Image Text:
2) Consider the screen shot below obtained from a scope in the lab. Displayed on the scope is
a signal (square wave) in both the time and frequency domains. Fill out the table below. Hint:
First determine the fundamental frequency, and then consider how harmonic frequencies are
obtained. Note: you can zoom in on this page on your computer to enlarge the plot if
necessary.
File Control View Window
Export +XY +Zoom FFT Spectrogram
Single
Stop
C1 V
>
Trig'd
Mode:
WF1 - Oscilloscope 1
Histogram Persistence
Data
Measurements
Logging
Audio
X Cursors
Y Cursors
Notes Digital Measurements
Repeated
Auto
Source:
Channel 1
Condition:
Rising
Level:
1V
C1 C2 8192 samples at 1.5873 MHz | 2020-07-21 10:36:33.227
Start:
0 Hz
Center: 10 kHz
Stop:
Span:
20 kHz
20 kHz
Top:
Units: dBV
0 dBV
-2.1 ms
-1.6 ms
-1.1 ms
-0.6 ms
-0.1 ms
0.4 ms
FFT
0.9 ms
1.4 ms
1.9 ms
Bottom:
-50 dBV
Type:
Sample
Reference: 1
Count:
100
2.4 ms
2.9 ms
Window:
Hamming
Beta:
8
dBV
10
Label
-5
-10
-15
-20
-25
-30
-35
-40
-45
-50
x
0 kHz
2 kHz
4 kHz
6 kHz
8 kHz
10 kHz
12 kHz
14 kHz
16 kHz
18 kHz
20 kHz
Harm. f(kHz) P(dBW)
n = 1
n = 2
n = 3
n = 4
n = 5
n = 6
n = 7
n = 8
n = 9
P(W)
check_circle الجواب — حل مفصل خطوة بخطوة
hourglass_top
🔒
الحل الكامل متاح للمشتركين
اشترك في أرشيف الأسئلة لعرض هذا الحل وآلاف الحلول المفصلة خطوة بخطوة من معلمين معتمدين.