تم الحل ✓
categoryهندسة مدنية
schoolبكالوريوس
event_available2026-07-15
السؤال
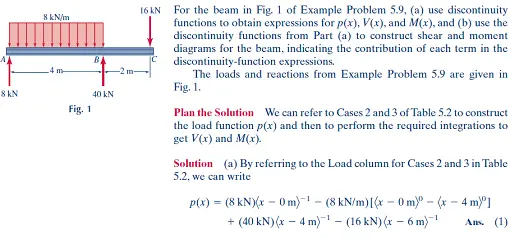
Transcribed Image Text:
8 kN
8 kN/m
4 m
Fig. 1
40 kN
-2 m-
16kN
For the beam in Fig. 1 of Example Problem 5.9, (a) use discontinuity
functions to obtain expressions for p(x), V(x), and M(x), and (b) use the
discontinuity functions from Part (a) to construct shear and moment
diagrams for the beam, indicating the contribution of each term in the
discontinuity-function expressions.
The loads and reactions from Example Problem 5.9 are given in
Fig. 1.
Plan the Solution We can refer to Cases 2 and 3 of Table 5.2 to construct
the load function p(x) and then to perform the required integrations to
get V(x) and M(x).
Solution (a) By referring to the Load column for Cases 2 and 3 in Table
5.2, we can write
-
p(x) (8 kN)(x 0m)-1-(8 kN/m)[(x -0 m)-(x-4 m)]
+(40 kN) (x -4 m) (16 kN) (x-6 m)¹ Ans. (1)
TABLE 5.2
Case
A Summary of Loads, Shear, and Moment Represented by Discontinuity Functions
Load
Shear
Ma
1
2
3
PX--
TL
5
P2
6
Po
(2)x-as
(3)α-973
Po-
-Max-a-
a
Moment
M
-Mix-
Mo
Mo
M
M
M
M
M
(
a
Pox-
Pa-a²
(2)α-a³
A
B
1.5 kips/ft
8 ft-
x
20 kips
12 ft
C
Figure 1 shows the simply supported beam of Example 5.2, including the
reactions. The expressions for V(x) and M(x) obtained in Example 5.2 are
V₁ (220 40x) lb, 0<x6ft.
V₁ =[-140+(12-x)²] lb. 6≤x<12ft
=
M₁ (220x20x)lb ft, 0<xs6 ft
My [140(12 x)-(12-x)] lb ft, 6x < 12 ft
=
(a) Using the above expressions for V(x) and M(x), plot shear and
moment diagrams for this simply supported beam. (b) Determine the
location of the section of maximum bending moment, and calculate the
value of the maximum moment.
40 lb/ft
A
220 lb
140 lb
-6ft
6ft
Fig. 1
Plan the Solution It is straightforward to plot the shear and moment
diagrams from the given expressions (e.g., using a computer). From the
shear diagram, the location of the section where V(x) = 0 can be deter-
mined. Then the appropriate moment equation can be used to determine
the value of the moment at this critical section. Since there is more load
over the left half of the beam than over the right half, the maximum mo-
ment should occur to the left of x = 6 ft.
Solution (a) Plot the shear diagram and the moment diagram. Figure 2
shows the plots of shear and bending moment.
(a) The shear
diagram.
уль)
220
12
-x(ft)
-140
M(lb-ft)
M-605 lb-ft
(b) The moment
diagram.
x(ft)
Fig. 2 Shear and moment diagrams.
(b) Determine the maximum bending moment. The maximum moment
occurs where the shear vanishes. From the shear diagram and the equa-
tion for V₁(x), it can be observed that V(x) = 0 in the interval 0<x<6 ft.
Therefore,
V₁(x)=220-40x = 0→x = 5.50 ft
Then, the maximum moment is
Max M (5.50 ft) = 605 lb ft
Ans. (b)
Review the Solution The downward load on this simply supported
beam bends it downward, so it is concave upward everywhere. This is
consistent with the fact that the bending moment is positive for the en-
tire length of the beam. As expected, since there is more load over the
left half of the beam than over the right half, the maximum moment does
occur to the left of x = 6 ft. This is an example of a maximum moment
that occurs where V = dM/dx = 0.
Derive expressions for V(x) and M(x) for the cantilever beam with lin-
early varying load shown in Fig. 1. Use these expressions to plot shear
and moment diagrams for this beam.
Po
pl),
pla)
MOO
Fig. 1
Plan the Solution We can use a finite free-body diagram to determine
the required expressions for V(x) and M(x).
Solution The triangle in the free-body diagram in Fig. 2 is similar to the
triangle in the problem statement; so, by similar triangles,
Po
P(x) = P(x) =
x
Vix)
+1ΣFy=0:
Fig. 2 A free-body diagram.
L
(+)P(x) - V(x) = 0
Aur
V(x)-2
21
Po
Ans
-M(x)-0
+C(M)--
20000
P
1.00
0.75-
0.50
0.25-
Quadratic-
curve
0.00
0.2 0.4
06 08 14
(a) The shear diagram
POR?
1.00
075
0.50-
Cubic
curve
0.25
0.00
0.2 0.4 0.6 0.8 1.0
(b) The moment diagram
Fig. 3 The shear diagram and the
moment diagram.
M(x)=
6L
Ans
To plot these expressions for the shear force V(x) and bending mo-
ment M(x), we first calculate V(L.) and M(L). Figure 3 shows the plots
of V(x) and M(x).
V(L)-PM(L)-P
Review the Solution The shear is positive everywhere, as we expect
from the free-body diagram. The maximum shear occurs at the cantilever
support at B and is equal to the total area under the load curve in Fig. 1.
The upward load will bend the beam upward, so it will be concave
upward everywhere. This is consistent with the fact that the bending
moment is positive for the entire length of the beam. The maximum
bending moment occurs at B. Finally, the shear and moment have the
proper dimensions (F) and (F L), respectively.
check_circle الجواب — حل مفصل خطوة بخطوة
hourglass_top
🔒
الحل الكامل متاح للمشتركين
اشترك في أرشيف الأسئلة لعرض هذا الحل وآلاف الحلول المفصلة خطوة بخطوة من معلمين معتمدين.