تم الحل ✓
categoryهندسة الحاسبات
schoolبكالوريوس
event_available2026-07-15
السؤال
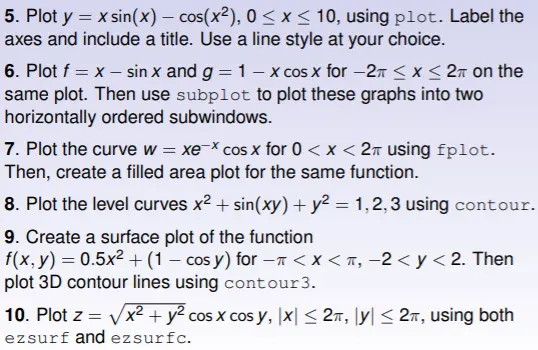
Transcribed Image Text:
5. Plot y = x sin(x) - cos(x²), 0 ≤x≤ 10, using plot. Label the
axes and include a title. Use a line style at your choice.
6. Plot f = x - sin x and g = 1 - x cos x for -2 ≤x≤2π on the
same plot. Then use subplot to plot these graphs into two
horizontally ordered subwindows.
7. Plot the curve w = xex cos x for 0 < x < 2 using fplot.
Then, create a filled area plot for the same function.
8. Plot the level curves x² + sin(xy) + y² = 1,2,3 using contour.
9. Create a surface plot of the function
f(x, y) = 0.5x² + (1 - cos y) for - <x<π, −2< y <2. Then
plot 3D contour lines using contour3.
10. Plot z = √√√x² + y² cos x cosy, |x| ≤2π, |y| ≤2π, using both
ezsurf and ezsurfc.
check_circle الجواب — حل مفصل خطوة بخطوة
hourglass_top
🔒
الحل الكامل متاح للمشتركين
اشترك في أرشيف الأسئلة لعرض هذا الحل وآلاف الحلول المفصلة خطوة بخطوة من معلمين معتمدين.