تم الحل ✓
categoryبرمجة وتطوير البرمجيات
schoolبكالوريوس
event_available2026-07-15
السؤال
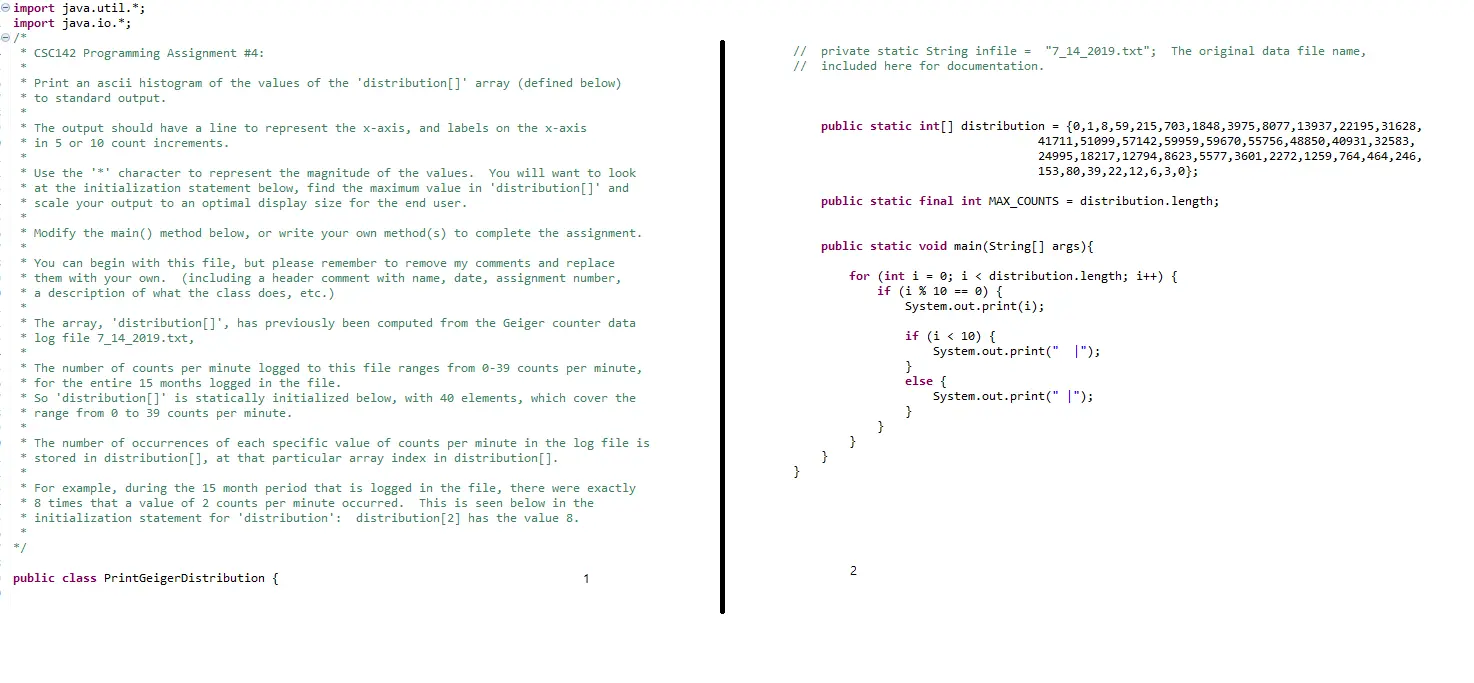
Transcribed Image Text:
import java.util.*;
import java.io.";
Ⓒ /*
* CSC142 Programming Assignment #4:
*
* Print an ascii histogram of the values of the 'distribution []' array (defined below)
*to standard output.
* The output should have a line to represent the x-axis, and labels on the x-axis
*in 5 or 10 count increments.
*
* Use the *** character to represent the magnitude of the values. You will want to look
* at the initialization statement below, find the maximum value in 'distribution[]' and
* scale your output to an optimal display size for the end user.
*
*
Modify the main() method below, or write your own method(s) to complete the assignment.
* You can begin with this file, but please remember to remove my comments and replace
* them with your own. (including a header comment with name, date, assignment number,
a description of what the class does, etc.)
*
*
* The array, 'distribution []', has previously been computed from the Geiger counter data
log file 7_14_2019.txt,
*
* The number of counts per minute logged to this file ranges from 0-39 counts per minute,
* for the entire 15 months logged in the file.
* So 'distribution []' is statically initialized below, with 40 elements, which cover the
range from 0 to 39 counts per minute.
*
*
* The number of occurrences of each specific value of counts per minute in the log file is
* stored in distribution [], at that particular array index in distribution[].
*
* For example, during the 15 month period that is logged in the file, there were exactly
* 8 times that a value of 2 counts per minute occurred. This is seen below in the
*
*
initialization statement for 'distribution': distribution [2] has the value 8.
// private static String infile = "7_14_2019.txt"; The original data file name,
// included here for documentation.
=
public static int[] distribution {0,1,8,59,215,703, 1848, 3975, 8077, 13937,22195,31628,
41711,51099,57142,59959,59670,55756,48850,40931,32583,
24995, 18217,12794,8623,5577,3601, 2272, 1259,764,464,246,
153,80,39,22,12,6,3,0};
public static final int MAX_COUNTS distribution.length;
=
public static void main(String[] args) {
for (int i = 0; i < distribution.length; i++) {
if (i % 10 0) {
2 2 2 2
==
System.out.print(i);
if (i < 10) {
}
System.out.print(" ");
else {
}
System.out.print(" ");
public class PrintGeigerDistribution {
1
2
check_circle الجواب — حل مفصل خطوة بخطوة
hourglass_top
🔒
الحل الكامل متاح للمشتركين
اشترك في أرشيف الأسئلة لعرض هذا الحل وآلاف الحلول المفصلة خطوة بخطوة من معلمين معتمدين.