تم الحل ✓
categoryإحصاء
schoolبكالوريوس
event_available2026-07-15
السؤال
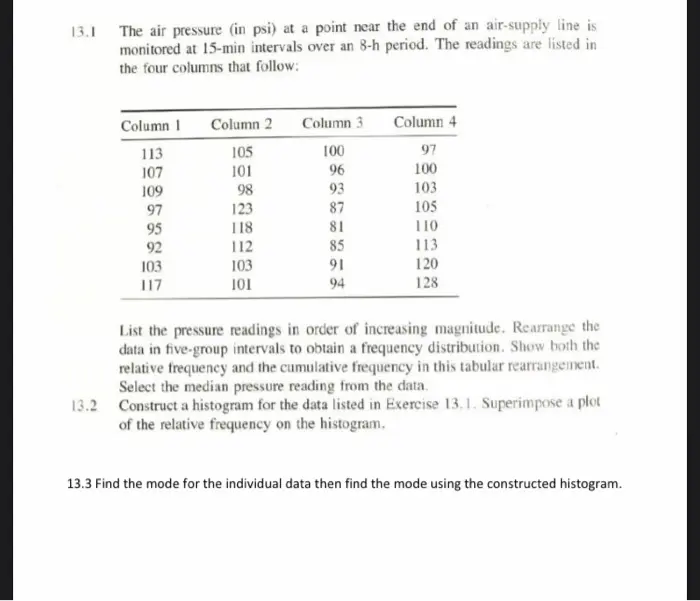
Transcribed Image Text:
13.1 The air pressure (in psi) at a point near the end of an air-supply line is
monitored at 15-min intervals over an 8-h period. The readings are listed in
the four columns that follow:
Column 1
Column 2
Column 3
Column 4
113
105
100
97
107
101
96
100
109
98
93
103
97
123
87
105
95
118
81
110
92
112
85
113
103
103
91
120
117
101
94
128
List the pressure readings in order of increasing magnitude. Rearrange the
data in five-group intervals to obtain a frequency distribution. Show both the
relative frequency and the cumulative frequency in this tabular rearrangement.
Select the median pressure reading from the data.
13.2 Construct a histogram for the data listed in Exercise 13.1. Superimpose a plot
of the relative frequency on the histogram.
13.3 Find the mode for the individual data then find the mode using the constructed histogram.
check_circle الجواب — حل مفصل خطوة بخطوة
hourglass_top
🔒
الحل الكامل متاح للمشتركين
اشترك في أرشيف الأسئلة لعرض هذا الحل وآلاف الحلول المفصلة خطوة بخطوة من معلمين معتمدين.