تم الحل ✓
categoryهندسة مواد
schoolبكالوريوس
event_available2026-07-15
السؤال
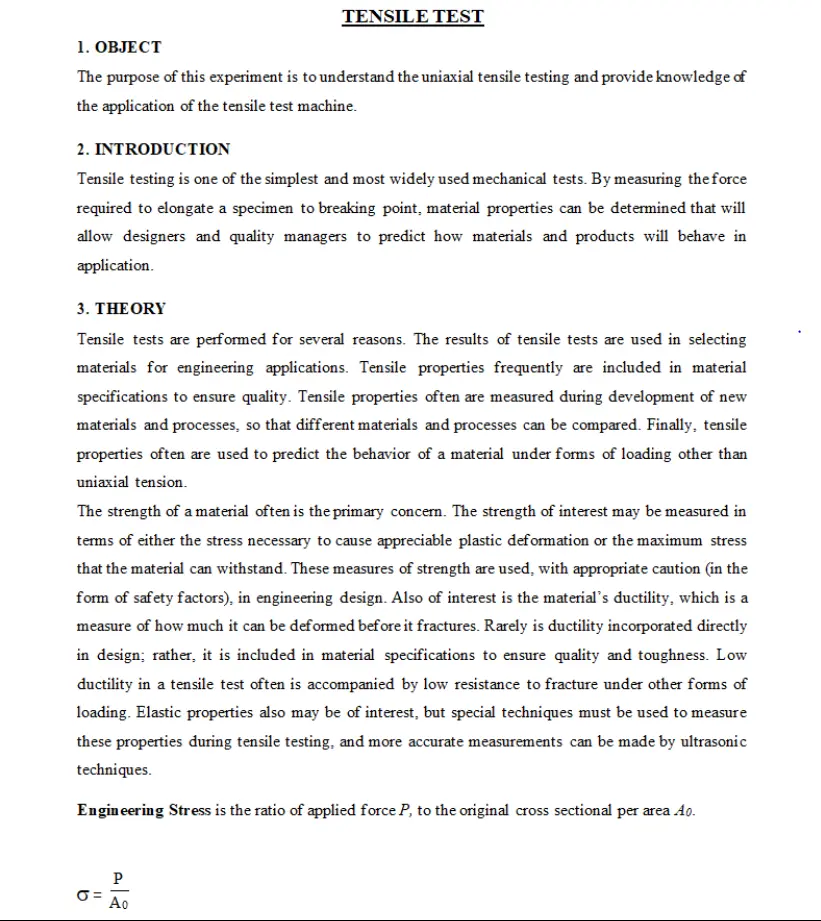
Transcribed Image Text:
TENSILE TEST
1. OBJECT
The purpose of this experiment is to understand the uniaxial tensile testing and provide knowledge of
the application of the tensile test machine.
2. INTRODUCTION
Tensile testing is one of the simplest and most widely used mechanical tests. By measuring the force
required to elongate a specimen to breaking point, material properties can be determined that will
allow designers and quality managers to predict how materials and products will behave in
application.
3. THEORY
Tensile tests are performed for several reasons. The results of tensile tests are used in selecting
materials for engineering applications. Tensile properties frequently are included in material
specifications to ensure quality. Tensile properties often are measured during development of new
materials and processes, so that different materials and processes can be compared. Finally, tensile
properties often are used to predict the behavior of a material under forms of loading other than
uniaxial tension.
The strength of a material often is the primary concern. The strength of interest may be measured in
terms of either the stress necessary to cause appreciable plastic deformation or the maximum stress
that the material can withstand. These measures of strength are used, with appropriate caution (in the
form of safety factors), in engineering design. Also of interest is the material's ductility, which is a
measure of how much it can be deformed before it fractures. Rarely is ductility incorporated directly
in design; rather, it is included in material specifications to ensure quality and toughness. Low
ductility in a tensile test often is accompanied by low resistance to fracture under other forms of
loading. Elastic properties also may be of interest, but special techniques must be used to measure
these properties during tensile testing, and more accurate measurements can be made by ultrasonic
techniques.
Engineering Stress is the ratio of applied force P, to the original cross sectional per area Ao.
σ =
P
Ao
O is engineering stress, P is the applied axial tensile load and Ao is the original cross-sectional area
There are three types of stresses an seen in Fig. 1.
FORCE
FORCE
STRESS
PLANE
STRESS
PLANE
PLANE
(A) TENSILE
(8) COMPRESSIVE
(C) SHEAR
Figure 1. Types of the stresses
Engineering Strain is defined as extension per unit length.
AL LE - Lo
Lo
Lo
E is the engineering strain
Lo is the original length of the specimen
Lr is the final length of the specimen
An example of the engineering stress-strain curve for a typical engineering alloy is shown in Figure
2. From it some very important properties can be determined. The elastic modulus, the yield strength,
the ultimate tensile strength, and the fracture strain are all clearly exhibited in an accurately
constructed stress strain curve.
ssaag
Ultimate tensile strength
Fracture strength
Yield streh
Necking
Fracture
Necking
Young's modulus slope
Fracture
stress/strain
Uniform plastic
deformation
Elastic
Plastic strain
strain.
Total strain
Non-uniform
plastic
deformation
Strain
True stress is the stress determined by the instantaneous load acting on the instantaneous cross-
sectional area (Fig. 3).
OT=P/Ai
True strain is the rate of instantaneous increase in the instantaneous gauge length (Fig.3).
ET=In (lilo)
Engineering or true stress (psi) x 10
True Stress-Strain Curve
140-
Fracture
130-
120-
110
100
90-
True stress-strain curve
70-
Engineering stress-strain curve
60
50
Fracture
σ =
40
30
20
10
10 20 30 40 50 60 70 80 90 100
Engineering or true strain (in./in. or mim) x 10
Figure 3. True Stress-strain curve
True stress-engineering stress relation:
OT=σ(8 + 1)
True strain-engineering strain relation:
ET=In (x + 1)
Elastic region: The part of the stress-strain curve up to the yielding point. Elastic deformation is
recoverable. In the elastic region stress and strain are related to each other linearly. E is Modulus of
Elasticity or Young Modulus which is specific for each type of material.
Hooke's Law: σ =E&
Plastic region: The part of the stress-strain diagram after the yielding point. At the yielding point,
the plastic deformation starts. Plastic deformation is permanent. At the maximum point of the stress-
strain diagram (Outs), necking starts.
Ultimate Tensile Strength, Outs is the maximum strength that material can withstand.
Outs
=
Pmax
Ao
Yield Strength, by is the stress level at which plastic deformation initiates. The beginning of first
plastic deformation is called yielding. 0,2% off-set method is a commonly used method to determine
the yield stength. 6y (0.2%) is found by drawing a parallel line to the the elastic region and the point
at which this line intersects with the stress-strain curve is set as the yielding point (Fig 4).
Tension stress-strain diagram
Aluminium alloy
Load
(stress)
Modulus Elastic limit
line
Offset
-m of
proportionality
eld strength
Elastic/zone Plastic zone
0.2%
Deflection (strain)
Figure 4. Stress-strain curve
Fracture Strength, 6F: After necking, plastic deformation is not uniform and the stress decreases
accordingly until fracture.
Pf
OF=-
Ao
Toughness: The ability of a metal to deform plastically and to absorb energy in the process before
fracture is termed toughness. The emphasis of this definition should be placed on the ability to absorb
energy before fracture. Toughness of the different materials is seen in the Fig. 5.
Stress-
High Carbon Steel
Medium Carbon Steel
Low Carbon Steel
Strain-
Fig. 5. Toughness of the materials
Ductility is a measure of how much something deforms plastically before fracture, but just because
a material is ductile does not make it tough. The key to toughness is a good combination of strength
and ductility. A material with high strength and high ductility will have more toughness than a
material with low strength and high ductility. Ductility can be described with the percent elongation
or percent reduction in area.
% Elongation = 100 (percent elongation)
%RA
Ag-A
AO
Lo
100 (percent reduction in area)
Resilience: By considering the area under the stress-strain curve in the elastic region, this area
represents the stored elastic energy or resilience.
4. EXPERIMENTS TO BE PERFORMED
The test unit will be introduced in the laboratory before the experiment by the relevant assistant.
Tensile Specimens: Consider the typical tensile specimen shown in Fig. 6. It has enlarged ends or
shoulders for gripping. The important part of the specimen is the gage section. The cross-sectional
area of the gage section is reduced relative to that of the remainder of the specimen so that
deformation and failure will be localized in this region. The gage length is the region over which
measurements are made and is centered within the reduced section. The distances between the ends
of the gage section and the shoulders should be great enough so that the larger ends do not constrain
deformation within the gage section, and the gage length should be great relative to its diameter.
Otherwise, the stress state will be more complex than simple tension.
GRIP SECTION
WIDTH OF
GRIP SECTION
OVERALL LENGTH
DISTANCE BETWEEN SHOULDERS
GAGE
LENGTH
DIA. OR WIDTH
"REDUCED SECTION
Figure 6. Test specimen
Test machine: The most common testing machines are universal testers, which test materials in
tension, compression, or bending. Their primary function is to create the stress-strain curve. Testing
machines are either electromechanical or hydraulic. The principal difference is the method by which
the load is applied. Electromechanical machines are based on a variable-speed electric motor; a gear
reduction system; and one, two, or four screws that move the crosshead up or down. This motion loads
the specimen in tension or compression. Crosshead speeds can be changed by changing the speed of
the motor (Fig.7)
Figure 7. Tension test equipment
Experimental steps: Specimen is machined in the desired orientation and according to the standarts.
Aluminum, steel or composite materials can be used as the specimen material mostly.
Magnitude of the load is chosen with respect to the tensile strength of the material. Specimen is fit to
the test machine. Maximum load is recorded during testing. After fracture of the material, final
length and diameter is measured. Diameter should be measured from the neck.
The necessary data for calculations will be recorded to the Table 1 given below.
Table 1. Data which is entered into the system
Measurement No:
Force, P[N]
Specimen dimension, do [mm]
Length, Lo [mm]
Steel
gage
4.1 Results
Calculate the values given in Table 2.
Table 2. Results obtained from test data
Details
Maximum force, Pmax [N]
Final length, Li[mm]
Final Diameter, de [mm]
Final Cross sectional area, A; [mm²]
Young Modulus, E [GPa]
Yield Strength, 6y. [MPa]
Ultimate tensile strength, outs [MPa]
Fracture stress, 6F [MPa]
% elongation
% area of reduction
Steel
Plot the engineering stress-strain on a milimetrical paper. Make scales for both x and y axis. Label
the known values.
5. REPORT
The laboratory reports must have the followings;
a) Cover page
b) A short introduction
c) All the necessary calculations using measured data.
d) Discussion of your results and a conclusion.
Data 5 (Aluminum)
Load (N) Elong. (mm)
4,454
0.025
13,361
0.076
22,269
0.127
31,176
0.178
33,403
0.762
35,185
2.032
35,630
3.048
35,407
4.064
33,848
5.207
Lo 50.8 mm, D=12.8 mm
D₁=12.2 mm
check_circle الجواب — حل مفصل خطوة بخطوة
hourglass_top
🔒
الحل الكامل متاح للمشتركين
اشترك في أرشيف الأسئلة لعرض هذا الحل وآلاف الحلول المفصلة خطوة بخطوة من معلمين معتمدين.