تم الحل ✓
categoryإحصاء
schoolبكالوريوس
event_available2026-07-15
السؤال
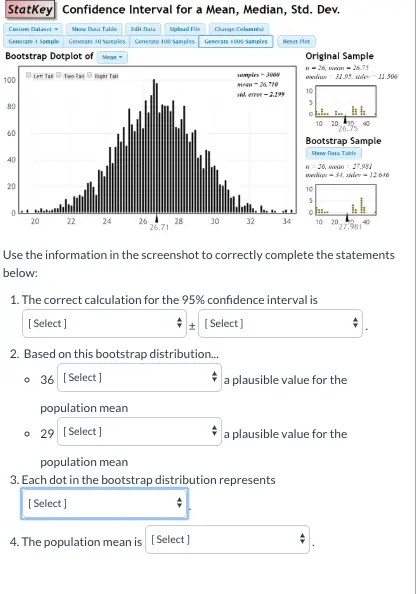
Transcribed Image Text:
StatKey Confidence Interval for a Mean, Median, Std. Dev.
Canion Data
Show Du Table
Edit Data
Upload File
Change Cola
Generate 1 Sample Generate 10 Samales Generate 100 Samples Generate 1000 Samples
Reset Plot
Bootstrap Dotplot of Mean
100
80
60
40
20
Original Sample
11-26, ww-26.75
semir-300
31.95, de 11.506
man-26710
sid error-2.199
10
5
h
10 20 30 40
Bootstrap Sample
Show DataTable
26, 27.981
wedia
10
34, -12.616
5
20
22
24
26
28
30
32
34
10 20
26.71
Use the information in the screenshot to correctly complete the statements
below:
1. The correct calculation for the 95% confidence interval is
[Select]
[Select]
2. Based on this bootstrap distribution...
• 36 [Select]
population mean
• 29 [Select]
a plausible value for the
a plausible value for the
population mean
3. Each dot in the bootstrap distribution represents
[Select]
4. The population mean is [Select]
Use the information in the screenshot to correctly complete the statements
below:
1. The correct calculation for the 95% confidence interval is
[Select]
[Select]
2. Based on this bootstrap distribution...
• 36 [Select]
✰ a plausible value for the
population mean
• 29 [Select]
✰ a plausible value for the
population mean
3. Each dot in the bootstrap distribution represents
✓ [Select]
one observation drawn from the entire population
the mean of a new sample of the same size drawn from the original population
the mean of a bootstrap sample drawn with replacement from the original sample
one observation drawn at random from the 26 cases in the sample
check_circle الجواب — حل مفصل خطوة بخطوة
hourglass_top
🔒
الحل الكامل متاح للمشتركين
اشترك في أرشيف الأسئلة لعرض هذا الحل وآلاف الحلول المفصلة خطوة بخطوة من معلمين معتمدين.