تم الحل ✓
categoryالرياضيات
schoolبكالوريوس
event_available2026-07-15
السؤال
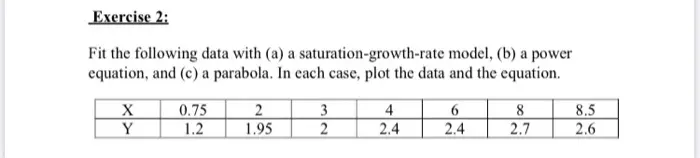
Transcribed Image Text:
Exercise 2:
Fit the following data with (a) a saturation-growth-rate model, (b) a power
equation, and (c) a parabola. In each case, plot the data and the equation.
X
0.75
2
3
4
6
8
Y
1.2
1.95
2
2.4
2.4
2.7
8.5
82
56
2.6
Exercise 1:
Given the data
X
5
10
15
20
Y
17 24
31
33
23
25
30
35
37 37
449
40
45
50
40 40 42
41
use least-squares regression to fit (a) a straight line, (b) a power equation, (c) a
saturation-growth-rate equation, and (d) a parabola. Plot the data along with all
the curves. Is any one of the curves superior? If so, justify
check_circle الجواب — حل مفصل خطوة بخطوة
hourglass_top
🔒
الحل الكامل متاح للمشتركين
اشترك في أرشيف الأسئلة لعرض هذا الحل وآلاف الحلول المفصلة خطوة بخطوة من معلمين معتمدين.